As per Intent Market Research, the Volumetric Display Market was valued at USD 4.6 Billion in 2024-e and will surpass USD 7.9 Billion by 2030; growing at a CAGR of 9.4% during 2025 - 2030.
The volumetric display market is witnessing rapid growth, fueled by advancements in display technology and the increasing demand for interactive, three-dimensional visuals across multiple sectors. Volumetric displays, which provide a realistic 3D experience without the need for special glasses, are finding applications in various industries, including healthcare, automotive, aerospace, and defense.
This market is driven by continuous innovation in display technologies such as laser-based and electro-holographic systems, as well as the need for enhanced user experiences in consumer electronics and medical devices. The ongoing research and development in display technology are expected to open new growth avenues and expand the market's potential in the coming years.
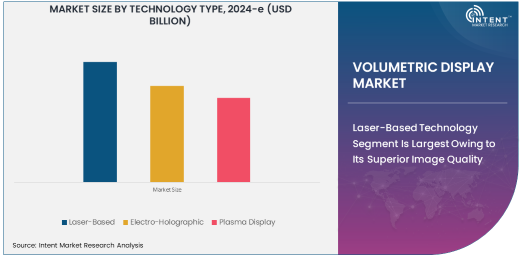
Laser-Based Technology Segment Is Largest Owing to Its Superior Image Quality
Among the various technology types, the laser-based segment dominates the volumetric display market, primarily due to its superior image quality and ability to deliver sharp, detailed, and vibrant 3D visuals. Laser-based systems are widely used in high-end applications such as medical imaging, advanced training simulations, and interactive gaming.
These systems offer significant advantages, including high brightness, wide viewing angles, and low energy consumption, making them ideal for both commercial and professional use. Furthermore, the continuous advancements in laser technology are expected to further improve performance, making laser-based volumetric displays even more appealing for a broader range of applications.
Hardware Component Leads the Market with Demand for High-Performance Displays
In the components segment, hardware is the largest sub-segment, driven by the need for robust and high-performance physical infrastructure in volumetric displays. The demand for hardware such as projectors, display panels, and computing systems has been consistently rising, as these components are integral to delivering the immersive 3D experiences that volumetric displays promise.
The rapid adoption of these displays in sectors like automotive, healthcare, and entertainment has further fueled the demand for high-quality, durable hardware. Moreover, the integration of advanced components, such as high-definition optics and real-time rendering processors, is expected to increase hardware sales, making it a critical driver in the market's growth.
Healthcare Application Is Fastest Growing Segment Due to Medical Advancements
The healthcare application segment is experiencing the fastest growth within the volumetric display market. As healthcare professionals increasingly rely on advanced technologies for medical imaging and surgical planning, volumetric displays are gaining traction for their ability to provide lifelike 3D visualizations.
These displays allow for detailed representation of organs, tissues, and medical procedures, which aids in better diagnosis, treatment planning, and patient education. Moreover, as the healthcare sector continues to embrace cutting-edge technology for precision medicine and complex surgeries, the demand for volumetric displays in this field is expected to grow at a rapid pace over the next few years.
Consumer Electronics End-Use Industry Is Largest Due to Rising Demand for Interactive Displays
Within the end-use industry segment, the consumer electronics market is the largest, as the demand for innovative, interactive displays continues to rise. Volumetric displays are increasingly being integrated into consumer devices like televisions, gaming consoles, and virtual reality systems.
These displays offer an immersive viewing experience, providing a more engaging and dynamic interface than traditional 2D displays. The continuous demand for more advanced, user-friendly consumer electronics, coupled with improvements in volumetric display technologies, is expected to sustain growth in this subsegment. Additionally, the popularity of augmented reality (AR) and virtual reality (VR) is further driving the adoption of volumetric displays in the consumer electronics sector.
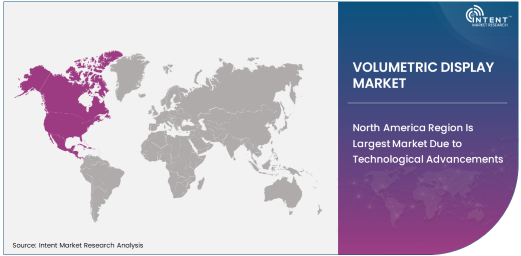
North America Region Is Largest Market Due to Technological Advancements
North America holds the largest market share in the volumetric display market, driven by significant technological advancements and the high adoption rate of 3D display systems in sectors such as healthcare, automotive, and entertainment. The United States, in particular, is a major hub for research and development in display technologies, with leading companies investing heavily in innovation. Furthermore, the region's robust infrastructure, coupled with a growing demand for interactive and immersive experiences, has accelerated the adoption of volumetric displays across various industries. The region is expected to continue to lead the market, supported by strong industrial presence and government initiatives promoting advanced technologies.
Competitive Landscape and Key Players
The competitive landscape of the volumetric display market is marked by the presence of key players specializing in advanced display technologies. Leading companies like Voxon Photonics, Burton Inc., and Zebra Medical Vision are at the forefront of innovation, offering a range of volumetric display solutions for diverse applications, including healthcare, automotive, and consumer electronics. These companies are continuously enhancing their product portfolios through strategic partnerships, mergers, and acquisitions, as well as investment in research and development. The competition in the market is intensifying as companies strive to deliver high-performance, cost-effective solutions that meet the evolving needs of industries relying on volumetric displays for enhanced user experiences.
Recent Developments:
- Light Field Lab secured funding to scale its laser-based volumetric display technology, targeting healthcare and automotive industries for immersive 3D visualization applications.
- Voxon Photonics launched an upgraded version of its 3D volumetric display, focusing on real-time interactive content for gaming and entertainment sectors.
- zSpace, Inc. announced a new partnership with educational institutions to integrate volumetric display technology for STEM education and interactive learning experiences.
- TriLite Technologies introduced a novel holographic projection system for automotive applications, enabling 3D navigation and user interface displays.
- Obscura Digital unveiled a state-of-the-art volumetric display installation for a major entertainment venue, providing an immersive, interactive experience for visitors.
List of Leading Companies:
- Light Field Lab
- Voxon Photonics
- Provision 3D Media
- TriLite Technologies
- zSpace, Inc.
- VividQ
- Holoxica Limited
- Disney Research
- Kyoto Institute of Technology
- Obscura Digital
- Holo-Light GmbH
- Sharp Corporation
- ViewSonic Corporation
- Microsoft Corporation
- Mitsubishi Electric Corporation
Report Scope:
|
Report Features |
Description |
|
Market Size (2024-e) |
USD 4.6 Billion |
|
Forecasted Value (2030) |
USD 7.9 Billion |
|
CAGR (2025 – 2030) |
9.4% |
|
Base Year for Estimation |
2024-e |
|
Historic Year |
2023 |
|
Forecast Period |
2025 – 2030 |
|
Report Coverage |
Market Forecast, Market Dynamics, Competitive Landscape, Recent Developments |
|
Segments Covered |
Volumetric Display Market by Technology Type (Laser-Based, Electro-Holographic, Plasma Display), by Component (Hardware, Software), by Application (Healthcare, Automotive, Aerospace and Defense), by End-Use Industry (Consumer Electronics, Automotive, Healthcare and Medical Devices), and by Region |
|
Regional Analysis |
North America (US, Canada, Mexico), Europe (Germany, France, UK, Italy, Spain, and Rest of Europe), Asia-Pacific (China, Japan, South Korea, Australia, India, and Rest of Asia-Pacific), Latin America (Brazil, Argentina, and Rest of Latin America), Middle East & Africa (Saudi Arabia, UAE, Rest of Middle East & Africa) |
|
Major Companies |
Light Field Lab, Voxon Photonics, Provision 3D Media, TriLite Technologies, zSpace, Inc., VividQ, Disney Research, Kyoto Institute of Technology, Obscura Digital, Holo-Light GmbH, Sharp Corporation, ViewSonic Corporation, Mitsubishi Electric Corporation |
|
Customization Scope |
Customization for segments, region/country-level will be provided. Moreover, additional customization can be done based on the requirements |
|
1. Introduction |
|
1.1. Market Definition |
|
1.2. Scope of the Study |
|
1.3. Research Assumptions |
|
1.4. Study Limitations |
|
2. Research Methodology |
|
2.1. Research Approach |
|
2.1.1. Top-Down Method |
|
2.1.2. Bottom-Up Method |
|
2.1.3. Factor Impact Analysis |
|
2.2. Insights & Data Collection Process |
|
2.2.1. Secondary Research |
|
2.2.2. Primary Research |
|
2.3. Data Mining Process |
|
2.3.1. Data Analysis |
|
2.3.2. Data Validation and Revalidation |
|
2.3.3. Data Triangulation |
|
3. Executive Summary |
|
3.1. Major Markets & Segments |
|
3.2. Highest Growing Regions and Respective Countries |
|
3.3. Impact of Growth Drivers & Inhibitors |
|
3.4. Regulatory Overview by Country |
|
4. Volumetric Display Market, by Technology Type (Market Size & Forecast: USD Million, 2023 – 2030) |
|
4.1. Laser-Based |
|
4.2. Electro-Holographic |
|
4.3. Plasma Display |
|
5. Volumetric Display Market, by Component (Market Size & Forecast: USD Million, 2023 – 2030) |
|
5.1. Hardware |
|
5.2. Software |
|
6. Volumetric Display Market, by Application (Market Size & Forecast: USD Million, 2023 – 2030) |
|
6.1. Healthcare |
|
6.2. Automotive |
|
6.3. Aerospace and Defense |
|
6.4. Others |
|
7. Volumetric Display Market, by End-Use Industry (Market Size & Forecast: USD Million, 2023 – 2030) |
|
7.1. Consumer Electronics |
|
7.2. Automotive |
|
7.3. Healthcare and Medical Devices |
|
7.4. Others |
|
8. Regional Analysis (Market Size & Forecast: USD Million, 2023 – 2030) |
|
8.1. Regional Overview |
|
8.2. North America |
|
8.2.1. Regional Trends & Growth Drivers |
|
8.2.2. Barriers & Challenges |
|
8.2.3. Opportunities |
|
8.2.4. Factor Impact Analysis |
|
8.2.5. Technology Trends |
|
8.2.6. North America Volumetric Display Market, by Technology Type |
|
8.2.7. North America Volumetric Display Market, by Component |
|
8.2.8. North America Volumetric Display Market, by Application |
|
8.2.9. North America Volumetric Display Market, by End-Use Industry |
|
8.2.10. By Country |
|
8.2.10.1. US |
|
8.2.10.1.1. US Volumetric Display Market, by Technology Type |
|
8.2.10.1.2. US Volumetric Display Market, by Component |
|
8.2.10.1.3. US Volumetric Display Market, by Application |
|
8.2.10.1.4. US Volumetric Display Market, by End-Use Industry |
|
8.2.10.2. Canada |
|
8.2.10.3. Mexico |
|
*Similar segmentation will be provided for each region and country |
|
8.3. Europe |
|
8.4. Asia-Pacific |
|
8.5. Latin America |
|
8.6. Middle East & Africa |
|
9. Competitive Landscape |
|
9.1. Overview of the Key Players |
|
9.2. Competitive Ecosystem |
|
9.2.1. Level of Fragmentation |
|
9.2.2. Market Consolidation |
|
9.2.3. Product Innovation |
|
9.3. Company Share Analysis |
|
9.4. Company Benchmarking Matrix |
|
9.4.1. Strategic Overview |
|
9.4.2. Product Innovations |
|
9.5. Start-up Ecosystem |
|
9.6. Strategic Competitive Insights/ Customer Imperatives |
|
9.7. ESG Matrix/ Sustainability Matrix |
|
9.8. Manufacturing Network |
|
9.8.1. Locations |
|
9.8.2. Supply Chain and Logistics |
|
9.8.3. Product Flexibility/Customization |
|
9.8.4. Digital Transformation and Connectivity |
|
9.8.5. Environmental and Regulatory Compliance |
|
9.9. Technology Readiness Level Matrix |
|
9.10. Technology Maturity Curve |
|
9.11. Buying Criteria |
|
10. Company Profiles |
|
10.1. Light Field Lab |
|
10.1.1. Company Overview |
|
10.1.2. Company Financials |
|
10.1.3. Product/Service Portfolio |
|
10.1.4. Recent Developments |
|
10.1.5. IMR Analysis |
|
*Similar information will be provided for other companies |
|
10.2. Voxon Photonics |
|
10.3. Provision 3D Media |
|
10.4. TriLite Technologies |
|
10.5. zSpace, Inc. |
|
10.6. VividQ |
|
10.7. Holoxica Limited |
|
10.8. Disney Research |
|
10.9. Kyoto Institute of Technology |
|
10.10. Obscura Digital |
|
10.11. Holo-Light GmbH |
|
10.12. Sharp Corporation |
|
10.13. ViewSonic Corporation |
|
10.14. Microsoft Corporation |
|
10.15. Mitsubishi Electric Corporation |
|
11. Appendix |
A comprehensive market research approach was employed to gather and analyze data on the Volumetric Display Market. In the process, the analysis was also done to analyze the parent market and relevant adjacencies to measure the impact of them on the Volumetric Display Market. The research methodology encompassed both secondary and primary research techniques, ensuring the accuracy and credibility of the findings.
.jpg)
Secondary Research
Secondary research involved a thorough review of pertinent industry reports, journals, articles, and publications. Additionally, annual reports, press releases, and investor presentations of industry players were scrutinized to gain insights into their market positioning and strategies.
Primary Research
Primary research involved conducting in-depth interviews with industry experts, stakeholders, and market participants across the E-Waste Management ecosystem. The primary research objectives included:
- Validating findings and assumptions derived from secondary research
- Gathering qualitative and quantitative data on market trends, drivers, and challenges
- Understanding the demand-side dynamics, encompassing end-users, component manufacturers, facility providers, and service providers
- Assessing the supply-side landscape, including technological advancements and recent developments
Market Size Assessment
A combination of top-down and bottom-up approaches was utilized to analyze the overall size of the Volumetric Display Market. These methods were also employed to assess the size of various subsegments within the market. The market size assessment methodology encompassed the following steps:
- Identification of key industry players and relevant revenues through extensive secondary research
- Determination of the industry's supply chain and market size, in terms of value, through primary and secondary research processes
- Calculation of percentage shares, splits, and breakdowns using secondary sources and verification through primary sources
.jpg)
Data Triangulation
To ensure the accuracy and reliability of the market size, data triangulation was implemented. This involved cross-referencing data from various sources, including demand and supply side factors, market trends, and expert opinions. Additionally, top-down and bottom-up approaches were employed to validate the market size assessment.
NA