As per Intent Market Research, the Virtual Shopping Assistant Market was valued at USD 1.2 billion in 2024-e and will surpass USD 2.3 billion by 2030; growing at a CAGR of 11.6% during 2025 - 2030.
The global virtual shopping assistant market is experiencing rapid growth, driven by advancements in artificial intelligence (AI), augmented reality (AR), and other transformative technologies. These solutions offer personalized shopping experiences, enhancing customer satisfaction while optimizing retailer operations. Virtual shopping assistants have become a cornerstone for modern commerce, catering to the evolving demands of tech-savvy consumers and businesses.
Retailers and e-commerce platforms are leveraging these assistants to deliver seamless, interactive, and efficient shopping journeys. The increasing integration of AI and AR technologies has enabled virtual assistants to simulate in-store experiences digitally, bridging the gap between online and offline shopping. The market’s growth is further fueled by the rise of mobile commerce and the proliferation of omnichannel strategies among retailers.
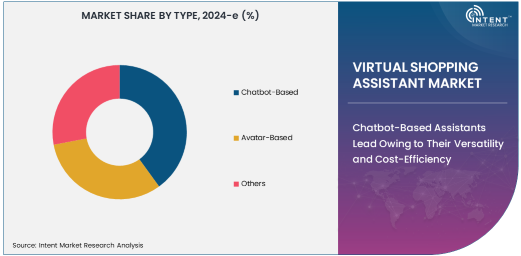
Chatbot-Based Assistants Lead Owing to Their Versatility and Cost-Efficiency
The chatbot-based segment dominates the market due to its versatility and cost-effectiveness. These virtual assistants are widely used across retail and e-commerce platforms to handle customer inquiries, recommend products, and facilitate transactions. Their ability to operate 24/7 and provide instant responses has made them indispensable for businesses aiming to improve customer engagement and retention.
The adoption of chatbot-based assistants is further driven by advancements in natural language processing (NLP) and machine learning (ML), which enable them to deliver personalized and context-aware responses. Their scalability and ease of deployment make them a preferred choice for small to medium-sized enterprises (SMEs) as well as large corporations.
Artificial Intelligence Technology Segment is Fastest Growing Owing to Advanced Personalization
AI is the fastest-growing technology in the virtual shopping assistant market, primarily due to its ability to deliver advanced personalization and predictive analytics. AI-powered assistants analyze customer behavior, preferences, and purchase history to provide tailored recommendations, boosting conversion rates and customer loyalty.
Retailers are increasingly integrating AI-driven assistants to enhance inventory management, optimize pricing strategies, and predict trends. As AI technologies continue to evolve, their applications in virtual shopping assistants are expanding, enabling more intuitive and effective interactions between businesses and customers.
Mobile Applications Platform Leads Owing to the Rise of Mobile Commerce
The mobile applications platform holds the largest share in the platform segment, driven by the widespread use of smartphones and the growing popularity of mobile commerce. Virtual shopping assistants embedded within mobile apps offer convenience and accessibility, enabling customers to shop anytime and anywhere.
Mobile-based assistants are equipped with features such as voice commands, AR-based try-on options, and instant payment solutions, enhancing the overall shopping experience. The increasing penetration of high-speed internet and the adoption of 5G technology are further accelerating the growth of this platform.
E-Commerce Industry is Fastest Growing in End-Use Industry Owing to Increasing Digitalization
Within the end-use industry segment, the e-commerce industry is the fastest-growing, propelled by the rapid digitalization of retail and changing consumer shopping habits. Virtual shopping assistants in e-commerce platforms streamline the purchasing process, improve customer support, and offer personalized product recommendations.
E-commerce giants are leveraging these assistants to differentiate their services, reduce cart abandonment rates, and enhance user experience. The continuous growth of online shopping, especially in emerging economies, and the increasing focus on omnichannel retail strategies are further fueling this segment's expansion.
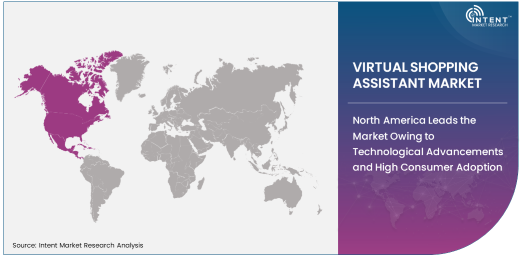
North America Leads the Market Owing to Technological Advancements and High Consumer Adoption
North America dominates the global virtual shopping assistant market, supported by its advanced technological infrastructure and high consumer adoption rates. The region is home to several leading tech companies and retailers that are investing heavily in virtual shopping technologies to stay competitive.
The U.S., in particular, has emerged as a key player, driven by a strong e-commerce ecosystem and the early adoption of AI and AR technologies. With a growing emphasis on enhancing customer experiences and streamlining operations, North America is expected to maintain its leadership position in the market.
Leading Companies and Competitive Landscape
The competitive landscape of the virtual shopping assistant market is marked by the presence of major players such as Amazon, Google, IBM, Microsoft, and Alibaba. These companies are driving innovation through AI, AR, and ML to develop advanced virtual assistant solutions.
Startups and niche technology providers are also gaining traction by offering specialized solutions tailored to specific industries and use cases. Strategic partnerships, acquisitions, and continuous R&D investments are common strategies among key players to strengthen their market position and meet the growing demand for virtual shopping assistants.
Recent Developments:
- In November 2024, Amazon announced new features for Alexa to improve personalized shopping recommendations.
- In October 2024, Google integrated its Assistant with new e-commerce platforms for enhanced shopping assistance.
- In September 2024, Salesforce launched an AI-driven virtual assistant tailored for retail and e-commerce businesses.
- In August 2024, Microsoft unveiled updates to its Cortana assistant, focusing on shopping and productivity features.
- In July 2024, Alibaba introduced a next-gen AR shopping assistant for its retail stores in Asia.
List of Leading Companies:
- Amazon.com, Inc. (Alexa)
- Google LLC (Google Assistant)
- Apple Inc. (Siri)
- IBM Corporation
- Microsoft Corporation
- Salesforce, Inc.
- Oracle Corporation
- SAP SE
- Nuance Communications, Inc.
- Baidu, Inc.
- Alibaba Group Holding Limited
- Samsung Electronics Co., Ltd.
- Meta Platforms, Inc.
- Cognizant Technology Solutions
- Infosys Limited
Report Scope:
|
Report Features |
Description |
|
Market Size (2024-e) |
USD 1.2 billion |
|
Forecasted Value (2030) |
USD 2.3 billion |
|
CAGR (2025 – 2030) |
11.6% |
|
Base Year for Estimation |
2024-e |
|
Historic Year |
2023 |
|
Forecast Period |
2025 – 2030 |
|
Report Coverage |
Market Forecast, Market Dynamics, Competitive Landscape, Recent Developments |
|
Segments Covered |
Virtual Shopping Assistant Market By Type (Chatbot-Based, Avatar-Based), By Technology (Artificial Intelligence (AI), Augmented Reality (AR), Natural Language Processing (NLP), Machine Learning (ML)), By Platform (Web-Based, Mobile Applications, In-Store Kiosks), By End-Use Industry (Retail, E-Commerce, Hospitality) |
|
Regional Analysis |
North America (US, Canada, Mexico), Europe (Germany, France, UK, Italy, Spain, and Rest of Europe), Asia-Pacific (China, Japan, South Korea, Australia, India, and Rest of Asia-Pacific), Latin America (Brazil, Argentina, and Rest of Latin America), Middle East & Africa (Saudi Arabia, UAE, Rest of Middle East & Africa) |
|
Major Companies |
Amazon.com, Inc. (Alexa), Google LLC (Google Assistant), Apple Inc. (Siri), IBM Corporation, Microsoft Corporation, Salesforce, Inc., Oracle Corporation, SAP SE, Nuance Communications, Inc., Baidu, Inc., Alibaba Group Holding Limited, Samsung Electronics Co., Ltd., Meta Platforms, Inc., Cognizant Technology Solutions, Infosys Limited |
|
Customization Scope |
Customization for segments, region/country-level will be provided. Moreover, additional customization can be done based on the requirements |
|
1. Introduction |
|
1.1. Market Definition |
|
1.2. Scope of the Study |
|
1.3. Research Assumptions |
|
1.4. Study Limitations |
|
2. Research Methodology |
|
2.1. Research Approach |
|
2.1.1. Top-Down Method |
|
2.1.2. Bottom-Up Method |
|
2.1.3. Factor Impact Analysis |
|
2.2. Insights & Data Collection Process |
|
2.2.1. Secondary Research |
|
2.2.2. Primary Research |
|
2.3. Data Mining Process |
|
2.3.1. Data Analysis |
|
2.3.2. Data Validation and Revalidation |
|
2.3.3. Data Triangulation |
|
3. Executive Summary |
|
3.1. Major Markets & Segments |
|
3.2. Highest Growing Regions and Respective Countries |
|
3.3. Impact of Growth Drivers & Inhibitors |
|
3.4. Regulatory Overview by Country |
|
4. Virtual Shopping Assistant Market, by Type (Market Size & Forecast: USD Million, 2023 – 2030) |
|
4.1. Chatbot-Based |
|
4.2. Avatar-Based |
|
4.3. Others |
|
5. Virtual Shopping Assistant Market, by Technology (Market Size & Forecast: USD Million, 2023 – 2030) |
|
5.1. Artificial Intelligence (AI) |
|
5.2. Augmented Reality (AR) |
|
5.3. Natural Language Processing (NLP) |
|
5.4. Machine Learning (ML) |
|
5.5. Others |
|
6. Virtual Shopping Assistant Market, by Platform (Market Size & Forecast: USD Million, 2023 – 2030) |
|
6.1. Web-Based |
|
6.2. Mobile Applications |
|
6.3. In-Store Kiosks |
|
6.4. Others |
|
7. Virtual Shopping Assistant Market, by End-Use Industry (Market Size & Forecast: USD Million, 2023 – 2030) |
|
7.1. Retail |
|
7.2. E-Commerce |
|
7.3. Hospitality |
|
7.4. Others |
|
8. Regional Analysis (Market Size & Forecast: USD Million, 2023 – 2030) |
|
8.1. Regional Overview |
|
8.2. North America |
|
8.2.1. Regional Trends & Growth Drivers |
|
8.2.2. Barriers & Challenges |
|
8.2.3. Opportunities |
|
8.2.4. Factor Impact Analysis |
|
8.2.5. Technology Trends |
|
8.2.6. North America Virtual Shopping Assistant Market, by Type |
|
8.2.7. North America Virtual Shopping Assistant Market, by Technology |
|
8.2.8. North America Virtual Shopping Assistant Market, by Platform |
|
8.2.9. North America Virtual Shopping Assistant Market, by End-Use Industry |
|
8.2.10. By Country |
|
8.2.10.1. US |
|
8.2.10.1.1. US Virtual Shopping Assistant Market, by Type |
|
8.2.10.1.2. US Virtual Shopping Assistant Market, by Technology |
|
8.2.10.1.3. US Virtual Shopping Assistant Market, by Platform |
|
8.2.10.1.4. US Virtual Shopping Assistant Market, by End-Use Industry |
|
8.2.10.2. Canada |
|
8.2.10.3. Mexico |
|
*Similar segmentation will be provided for each region and country |
|
8.3. Europe |
|
8.4. Asia-Pacific |
|
8.5. Latin America |
|
8.6. Middle East & Africa |
|
9. Competitive Landscape |
|
9.1. Overview of the Key Players |
|
9.2. Competitive Ecosystem |
|
9.2.1. Level of Fragmentation |
|
9.2.2. Market Consolidation |
|
9.2.3. Product Innovation |
|
9.3. Company Share Analysis |
|
9.4. Company Benchmarking Matrix |
|
9.4.1. Strategic Overview |
|
9.4.2. Product Innovations |
|
9.5. Start-up Ecosystem |
|
9.6. Strategic Competitive Insights/ Customer Imperatives |
|
9.7. ESG Matrix/ Sustainability Matrix |
|
9.8. Manufacturing Network |
|
9.8.1. Locations |
|
9.8.2. Supply Chain and Logistics |
|
9.8.3. Product Flexibility/Customization |
|
9.8.4. Digital Transformation and Connectivity |
|
9.8.5. Environmental and Regulatory Compliance |
|
9.9. Technology Readiness Level Matrix |
|
9.10. Technology Maturity Curve |
|
9.11. Buying Criteria |
|
10. Company Profiles |
|
10.1. Amazon.com, Inc. (Alexa) |
|
10.1.1. Company Overview |
|
10.1.2. Company Financials |
|
10.1.3. Product/Service Portfolio |
|
10.1.4. Recent Developments |
|
10.1.5. IMR Analysis |
|
*Similar information will be provided for other companies |
|
10.2. Google LLC (Google Assistant) |
|
10.3. Apple Inc. (Siri) |
|
10.4. IBM Corporation |
|
10.5. Microsoft Corporation |
|
10.6. Salesforce, Inc. |
|
10.7. Oracle Corporation |
|
10.8. SAP SE |
|
10.9. Nuance Communications, Inc. |
|
10.10. Baidu, Inc. |
|
10.11. Alibaba Group Holding Limited |
|
10.12. Samsung Electronics Co., Ltd. |
|
10.13. Meta Platforms, Inc. |
|
10.14. Cognizant Technology Solutions |
|
10.15. Infosys Limited |
|
11. Appendix |
A comprehensive market research approach was employed to gather and analyze data on the Virtual Shopping Assistant Market. In the process, the analysis was also done to analyze the parent market and relevant adjacencies to measure the impact of them on the Virtual Shopping Assistant Market. The research methodology encompassed both secondary and primary research techniques, ensuring the accuracy and credibility of the findings.
.jpg)
Secondary Research
Secondary research involved a thorough review of pertinent industry reports, journals, articles, and publications. Additionally, annual reports, press releases, and investor presentations of industry players were scrutinized to gain insights into their market positioning and strategies.
Primary Research
Primary research involved conducting in-depth interviews with industry experts, stakeholders, and market participants across the E-Waste Management ecosystem. The primary research objectives included:
- Validating findings and assumptions derived from secondary research
- Gathering qualitative and quantitative data on market trends, drivers, and challenges
- Understanding the demand-side dynamics, encompassing end-users, component manufacturers, facility providers, and service providers
- Assessing the supply-side landscape, including technological advancements and recent developments
Market Size Assessment
A combination of top-down and bottom-up approaches was utilized to analyze the overall size of the Virtual Shopping Assistant Market. These methods were also employed to assess the size of various subsegments within the market. The market size assessment methodology encompassed the following steps:
- Identification of key industry players and relevant revenues through extensive secondary research
- Determination of the industry's supply chain and market size, in terms of value, through primary and secondary research processes
- Calculation of percentage shares, splits, and breakdowns using secondary sources and verification through primary sources
.jpg)
Data Triangulation
To ensure the accuracy and reliability of the market size, data triangulation was implemented. This involved cross-referencing data from various sources, including demand and supply side factors, market trends, and expert opinions. Additionally, top-down and bottom-up approaches were employed to validate the market size assessment.
NA