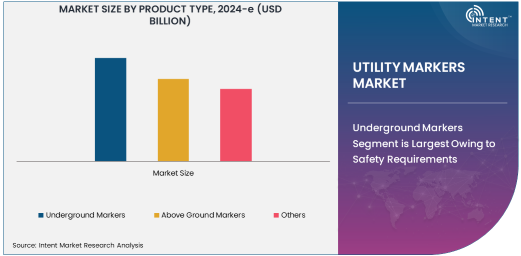
As per Intent Market Research, the Utility Markers Market was valued at USD 3.4 billion in 2024-e and will surpass USD 6.8 billion by 2030; growing at a CAGR of 10.3% during 2025 - 2030.
The global utility markers market is experiencing significant growth due to increasing safety requirements, infrastructure development, and the need for efficient maintenance of utility systems. Utility markers are used across various industries to provide clear and visible identification of underground and above-ground utility lines, ensuring that workers can perform their jobs safely and efficiently. These markers are critical in industries like oil and gas, power utilities, telecommunications, and water management, as they prevent accidental damage to infrastructure and enhance regulatory compliance. The market is expected to grow due to advancements in material technologies, regulatory requirements for safety, and the expanding infrastructure in emerging regions.
Underground Markers Segment is Largest Owing to Safety Requirements
The underground markers segment holds the largest market share in the utility markers industry, driven by the increasing focus on safety and maintenance of underground infrastructure. These markers are used extensively in sectors like oil and gas, water, and wastewater management, where underground pipelines, cables, and other utilities are prevalent. As these systems are often buried beneath the surface, effective identification is critical to avoid accidental damage during excavation or construction activities. The demand for underground markers is anticipated to grow significantly due to stricter regulatory standards, the need for infrastructure upgrades, and the rising adoption of technologies for better utility management.
Underground markers come in various materials, including plastic, fiberglass, and metal, and they are designed to be highly durable and visible in harsh environmental conditions. These markers are vital for ensuring that pipelines and cables are easily identified, preventing costly and dangerous accidents. With technological advancements, manufacturers are introducing more efficient and cost-effective solutions, such as markers with built-in RFID tags for easy tracking and maintenance.
Pipeline Markers Segment is Fastest Growing Owing to Infrastructure Development
The pipeline markers segment is witnessing the fastest growth in the utility markers market, driven by the growing need for pipeline safety and the continuous expansion of pipeline infrastructure globally. The oil and gas industry, in particular, relies heavily on pipeline markers to help workers locate and maintain pipelines, which are often located in remote and hard-to-access areas. Pipeline markers play an essential role in mitigating the risks associated with construction, maintenance, and repair work around pipelines, thus boosting the demand for these markers.
The increased focus on pipeline safety, particularly in regions with aging infrastructure, is propelling the demand for advanced markers. Additionally, the integration of pipeline markers with technology, such as GPS tracking and real-time monitoring, has made it easier for operators to track the condition of pipelines and perform timely maintenance. The growing energy demand and investments in new pipeline construction projects worldwide further contribute to the rapid expansion of the pipeline markers segment.
Oil & Gas Industry is Largest End-User Owing to Expanding Infrastructure
The oil and gas industry remains the largest end-user of utility markers due to the substantial infrastructure in pipelines, valves, and other underground and above-ground utility systems. The need for clear, durable, and highly visible markers in this sector is paramount, as these markers ensure that critical infrastructure is properly identified and maintained. The increasing exploration and production activities in remote regions, where pipelines often cross challenging terrains, have further heightened the need for reliable utility marking solutions.
The growth in oil and gas infrastructure, particularly in emerging markets, has driven significant investments in utility marker systems to ensure safety and regulatory compliance. In addition, the rise of offshore oil and gas operations is pushing for advanced markers that can withstand harsh environmental conditions such as extreme temperatures and corrosive environments. The oil and gas sector’s dominance in utility markers usage is set to continue as the demand for energy increases globally, and more pipeline and transmission projects are developed.
Plastic Material Type is Largest Due to Cost-Effectiveness and Durability
The plastic material type dominates the utility markers market due to its cost-effectiveness, durability, and versatility. Plastic markers are widely used for both underground and above-ground applications, offering long-lasting solutions in a range of environmental conditions. These markers are highly resistant to corrosion, UV radiation, and other environmental factors, making them ideal for outdoor use in sectors like oil and gas, telecommunications, and water management.
Plastic utility markers are also lightweight, easy to transport, and relatively inexpensive compared to metal and fiberglass options. The ability to customize plastic markers with specific colors, shapes, and branding further contributes to their widespread adoption. As demand for low-cost, efficient solutions increases, the plastic segment is expected to maintain its dominant position in the market.
Online Retail Segment is Fastest Growing Owing to Increased E-Commerce Adoption
The online retail segment is witnessing the fastest growth in the utility markers market, driven by the increasing adoption of e-commerce platforms and the convenience of direct-to-consumer sales. Online platforms enable customers to purchase utility markers from the comfort of their homes or offices, ensuring quick delivery and access to a wide variety of products. This trend has been particularly beneficial for small to medium-sized enterprises, who can easily procure markers without having to rely on traditional retail outlets.
The growing e-commerce industry has also led to better transparency in product offerings, enabling consumers to compare different utility marker types, materials, and prices with ease. Additionally, online platforms offer a wealth of information about product specifications, which helps buyers make informed purchasing decisions. As more consumers embrace online shopping, the online retail segment in the utility markers market is expected to expand rapidly.
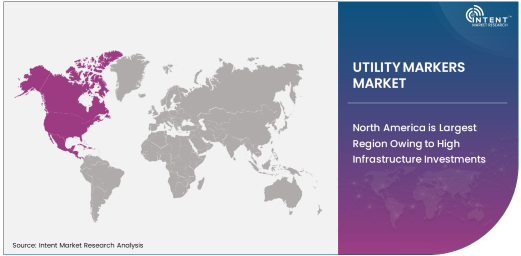
North America is Largest Region Owing to High Infrastructure Investments
North America remains the largest region in the utility markers market, owing to the substantial investments in infrastructure development and safety regulations. The U.S. and Canada are major contributors to the demand for utility markers, driven by large-scale projects in oil and gas, power, and utilities sectors. North America has stringent safety standards that require the widespread use of utility markers to prevent accidents and ensure proper maintenance of utility systems.
The region’s growing energy demands, combined with increasing government initiatives to modernize aging infrastructure, contribute to the rising need for utility markers. Additionally, advancements in technology, such as the use of GPS and RFID-enabled markers, are further bolstering the market’s growth in North America. With continued investments in infrastructure and safety, North America is expected to remain the dominant market for utility markers in the coming years.
Leading Companies and Competitive Landscape
The utility markers market is competitive, with a range of global and regional players offering a variety of products to cater to different industries and applications. Leading companies such as 3M, Brady Corporation, and Seton have established strong market positions by offering durable, customizable, and innovative utility markers that meet industry safety standards. These companies continuously invest in research and development to enhance their product offerings, including the incorporation of advanced technologies such as RFID tracking and GPS integration.
Smaller players are also entering the market by offering niche products designed for specific applications, while larger companies are expanding their market presence through mergers and acquisitions. The competitive landscape is expected to intensify as demand for utility markers grows across emerging markets and industries, prompting companies to focus on product differentiation, improved customer service, and strategic collaborations to maintain a competitive edge
Recent Developments:
- 3M has launched a new range of durable underground utility markers for enhanced safety in pipeline identification, featuring advanced weather-resistant technology.
- Brady Corporation recently announced a merger with a leading utility marker solutions provider to expand its product range and increase market share in North America.
- Gardner Denver introduced an updated line of flexible, weatherproof markers designed for pipeline applications in the oil and gas industry, further improving operational safety.
- Utility Marker Systems Inc. was granted a patent for a new type of environmentally friendly, biodegradable underground utility marker, expected to launch in early 2024.
- REA Plastik GmbH has partnered with several telecom companies to offer specialized marker solutions for telecom cable identification, expected to drive significant growth in the sector
List of Leading Companies:
- 3M
- Brady Corporation
- Gardner Denver
- Seton
- Pro-Line Safety Products
- ULINE
- Utility Marker Systems Inc.
- REA Plastik GmbH
- Avery Dennison
- HellermannTyton
- Jack & Heintz Inc.
- Marking Services
- R.G. Ray Corporation
- Jamar Products
- Transline Technologies
Report Scope:
|
Report Features |
Description |
|
Market Size (2024-e) |
USD 3.4 Billion |
|
Forecasted Value (2030) |
USD 6.8 Billion |
|
CAGR (2025 – 2030) |
10.3% |
|
Base Year for Estimation |
2024-e |
|
Historic Year |
2023 |
|
Forecast Period |
2025 – 2030 |
|
Report Coverage |
Market Forecast, Market Dynamics, Competitive Landscape, Recent Developments |
|
Segments Covered |
Utility Markers Market by Product Type (Underground Markers, Above Ground Markers), by Application (Pipeline Markers, Cable Markers, Valve Markers, Junction Box Markers), by End-User Industry (Oil & Gas, Power & Utilities, Telecommunications, Water & Wastewater), by Material Type (Plastic, Metal, Fiberglass), and by Distribution Channel (Online Retail, Offline Retail, Direct Sales, Distributors) |
|
Regional Analysis |
North America (US, Canada, Mexico), Europe (Germany, France, UK, Italy, Spain, and Rest of Europe), Asia-Pacific (China, Japan, South Korea, Australia, India, and Rest of Asia-Pacific), Latin America (Brazil, Argentina, and Rest of Latin America), Middle East & Africa (Saudi Arabia, UAE, Rest of Middle East & Africa) |
|
Major Companies |
3M, Brady Corporation, Gardner Denver, Seton, Pro-Line Safety Products, ULINE, Utility Marker Systems Inc., REA Plastik GmbH, Avery Dennison, HellermannTyton, Jack & Heintz Inc., Marking Services, R.G. Ray Corporation, Jamar Products, Transline Technologies |
|
Customization Scope |
Customization for segments, region/country-level will be provided. Moreover, additional customization can be done based on the requirements |
|
1. Introduction |
|
1.1. Market Definition |
|
1.2. Scope of the Study |
|
1.3. Research Assumptions |
|
1.4. Study Limitations |
|
2. Research Methodology |
|
2.1. Research Approach |
|
2.1.1. Top-Down Method |
|
2.1.2. Bottom-Up Method |
|
2.1.3. Factor Impact Analysis |
|
2.2. Insights & Data Collection Process |
|
2.2.1. Secondary Research |
|
2.2.2. Primary Research |
|
2.3. Data Mining Process |
|
2.3.1. Data Analysis |
|
2.3.2. Data Validation and Revalidation |
|
2.3.3. Data Triangulation |
|
3. Executive Summary |
|
3.1. Major Markets & Segments |
|
3.2. Highest Growing Regions and Respective Countries |
|
3.3. Impact of Growth Drivers & Inhibitors |
|
3.4. Regulatory Overview by Country |
|
4. Utility Markers Market, by Product Type (Market Size & Forecast: USD Million, 2023 – 2030) |
|
4.1. Underground Markers |
|
4.2. Above Ground Markers |
|
4.3. Others |
|
5. Utility Markers Market, by Application (Market Size & Forecast: USD Million, 2023 – 2030) |
|
5.1. Pipeline Markers |
|
5.2. Cable Markers |
|
5.3. Valve Markers |
|
5.4. Junction Box Markers |
|
5.5. Others |
|
6. Utility Markers Market, by End-User Industry (Market Size & Forecast: USD Million, 2023 – 2030) |
|
6.1. Oil & Gas |
|
6.2. Power & Utilities |
|
6.3. Telecommunications |
|
6.4. Water & Wastewater |
|
6.5. Others |
|
7. Utility Markers Market, by Material Type (Market Size & Forecast: USD Million, 2023 – 2030) |
|
7.1. Plastic |
|
7.2. Metal |
|
7.3. Fiberglass |
|
7.4. Others |
|
8. Utility Markers Market, by Distribution Channel (Market Size & Forecast: USD Million, 2023 – 2030) |
|
8.1. Online Retail |
|
8.2. Offline Retail |
|
8.3. Direct Sales |
|
8.4. Distributors |
|
9. Regional Analysis (Market Size & Forecast: USD Million, 2023 – 2030) |
|
9.1. Regional Overview |
|
9.2. North America |
|
9.2.1. Regional Trends & Growth Drivers |
|
9.2.2. Barriers & Challenges |
|
9.2.3. Opportunities |
|
9.2.4. Factor Impact Analysis |
|
9.2.5. Technology Trends |
|
9.2.6. North America Utility Markers Market, by Product Type |
|
9.2.7. North America Utility Markers Market, by Application |
|
9.2.8. North America Utility Markers Market, by End-User Industry |
|
9.2.9. North America Utility Markers Market, by Material Type |
|
9.2.10. North America Utility Markers Market, by Distribution Channel |
|
9.2.11. By Country |
|
9.2.11.1. US |
|
9.2.11.1.1. US Utility Markers Market, by Product Type |
|
9.2.11.1.2. US Utility Markers Market, by Application |
|
9.2.11.1.3. US Utility Markers Market, by End-User Industry |
|
9.2.11.1.4. US Utility Markers Market, by Material Type |
|
9.2.11.1.5. US Utility Markers Market, by Distribution Channel |
|
9.2.11.2. Canada |
|
9.2.11.3. Mexico |
|
*Similar segmentation will be provided for each region and country |
|
9.3. Europe |
|
9.4. Asia-Pacific |
|
9.5. Latin America |
|
9.6. Middle East & Africa |
|
10. Competitive Landscape |
|
10.1. Overview of the Key Players |
|
10.2. Competitive Ecosystem |
|
10.2.1. Level of Fragmentation |
|
10.2.2. Market Consolidation |
|
10.2.3. Product Innovation |
|
10.3. Company Share Analysis |
|
10.4. Company Benchmarking Matrix |
|
10.4.1. Strategic Overview |
|
10.4.2. Product Innovations |
|
10.5. Start-up Ecosystem |
|
10.6. Strategic Competitive Insights/ Customer Imperatives |
|
10.7. ESG Matrix/ Sustainability Matrix |
|
10.8. Manufacturing Network |
|
10.8.1. Locations |
|
10.8.2. Supply Chain and Logistics |
|
10.8.3. Product Flexibility/Customization |
|
10.8.4. Digital Transformation and Connectivity |
|
10.8.5. Environmental and Regulatory Compliance |
|
10.9. Technology Readiness Level Matrix |
|
10.10. Technology Maturity Curve |
|
10.11. Buying Criteria |
|
11. Company Profiles |
|
11.1. 3M |
|
11.1.1. Company Overview |
|
11.1.2. Company Financials |
|
11.1.3. Product/Service Portfolio |
|
11.1.4. Recent Developments |
|
11.1.5. IMR Analysis |
|
*Similar information will be provided for other companies |
|
11.2. Brady Corporation |
|
11.3. Gardner Denver |
|
11.4. Seton |
|
11.5. Pro-Line Safety Products |
|
11.6. ULINE |
|
11.7. Utility Marker Systems Inc. |
|
11.8. REA Plastik GmbH |
|
11.9. Avery Dennison |
|
11.10. HellermannTyton |
|
11.11. Jack & Heintz Inc. |
|
11.12. Marking Services |
|
11.13. R.G. Ray Corporation |
|
11.14. Jamar Products |
|
11.15. Transline Technologies |
|
12. Appendix |
A comprehensive market research approach was employed to gather and analyze data on the Utility Markers Market. In the process, the analysis was also done to analyze the parent market and relevant adjacencies to measure the impact of them on the Utility Markers Market. The research methodology encompassed both secondary and primary research techniques, ensuring the accuracy and credibility of the findings.
.jpg)
Secondary Research
Secondary research involved a thorough review of pertinent industry reports, journals, articles, and publications. Additionally, annual reports, press releases, and investor presentations of industry players were scrutinized to gain insights into their market positioning and strategies.
Primary Research
Primary research involved conducting in-depth interviews with industry experts, stakeholders, and market participants across the E-Waste Management ecosystem. The primary research objectives included:
- Validating findings and assumptions derived from secondary research
- Gathering qualitative and quantitative data on market trends, drivers, and challenges
- Understanding the demand-side dynamics, encompassing end-users, component manufacturers, facility providers, and service providers
- Assessing the supply-side landscape, including technological advancements and recent developments
Market Size Assessment
A combination of top-down and bottom-up approaches was utilized to analyze the overall size of the Utility Markers Market. These methods were also employed to assess the size of various subsegments within the market. The market size assessment methodology encompassed the following steps:
- Identification of key industry players and relevant revenues through extensive secondary research
- Determination of the industry's supply chain and market size, in terms of value, through primary and secondary research processes
- Calculation of percentage shares, splits, and breakdowns using secondary sources and verification through primary sources
.jpg)
Data Triangulation
To ensure the accuracy and reliability of the market size, data triangulation was implemented. This involved cross-referencing data from various sources, including demand and supply side factors, market trends, and expert opinions. Additionally, top-down and bottom-up approaches were employed to validate the market size assessment.
NA