As per Intent Market Research, the Utility Communication Market was valued at USD 25.6 billion in 2024-e and will surpass USD 44.7 billion by 2030; growing at a CAGR of 8.3% during 2025 - 2030.
The utility communication market is experiencing rapid growth, driven by the increasing need for utilities to enhance their infrastructure and operations through effective communication technologies. Utilities, including electricity, water, and gas, are adopting advanced communication systems to manage complex networks, improve efficiency, and meet rising demand for smart solutions. The integration of communication technologies in utilities is essential for the seamless operation of systems such as smart grids, metering systems, and demand response programs.
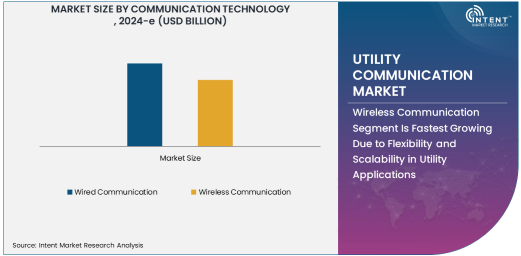
The market is characterized by the adoption of both wired and wireless communication technologies, with each serving different needs within the utility sector. Wired communication provides reliability and stability, often used for critical infrastructure, while wireless communication offers flexibility, scalability, and cost-effectiveness, especially in remote or hard-to-reach areas. As the global shift toward digitalization and smart technologies intensifies, the demand for sophisticated utility communication solutions is expected to increase, especially in regions where utilities are implementing or upgrading smart grids and automation systems.
Wireless Communication Segment Is Fastest Growing Due to Flexibility and Scalability in Utility Applications
Wireless communication technology is the fastest-growing segment in the utility communication market, driven by the flexibility, scalability, and cost-effectiveness it offers in utility applications. As utilities seek more efficient ways to manage their networks, wireless communication provides a solution that can easily be scaled, extended, and implemented in various regions. Wireless communication enables critical applications like smart grid operations, remote monitoring, and advanced metering infrastructure, which require real-time data transfer and connectivity across dispersed locations.
The wireless segment includes technologies like cellular networks, radio frequency (RF), and power line communication (PLC), which are becoming increasingly important in managing complex utility networks. Wireless communication also plays a key role in demand response systems, where it helps utilities interact with smart devices and meters to optimize energy consumption. With the growing need for connectivity and real-time data exchange, wireless communication is expected to continue expanding in utility sectors, making it a pivotal technology in the market’s evolution.
Smart Grids Segment Is Largest Due to Growing Demand for Energy Efficiency and Grid Reliability
The smart grids segment is the largest application in the utility communication market, as utilities worldwide focus on modernizing their power grids to improve energy efficiency, reliability, and sustainability. Smart grids leverage advanced communication technologies to enable two-way communication between utility providers and consumers, allowing for better load management, fault detection, and real-time data collection. These grids are equipped with sensors, advanced metering systems, and automation tools that enhance operational efficiency and enable dynamic energy distribution.
The demand for smart grids has grown significantly due to increasing energy demands, the need for better resource management, and the integration of renewable energy sources. Smart grids allow utilities to optimize energy distribution, reduce outages, and integrate clean energy solutions, providing both operational benefits and environmental sustainability. As governments and utilities continue to invest in smart grid technology, this segment will remain the largest contributor to the utility communication market, with significant advancements in communication protocols such as optical fiber and cellular networks helping to strengthen their functionality.
Utilities (Electricity) Segment Is Largest End-User Due to Increased Infrastructure Investments and Smart Solutions Adoption
The electricity utilities segment is the largest end-user in the utility communication market, driven by the substantial investments in infrastructure modernization and the growing adoption of smart technologies. As the global demand for electricity continues to rise, electricity providers are turning to advanced communication systems to manage the complexities of their networks, ensure reliable service, and enhance operational efficiencies. The need for smart grids, metering systems, and real-time monitoring is crucial in optimizing electricity distribution, detecting faults, and managing energy consumption.
In addition to smart grid technologies, electricity utilities are increasingly adopting automation systems for grid management, demand response programs to balance energy loads, and advanced metering infrastructure (AMI) to facilitate accurate billing and data collection. The increasing push toward renewable energy integration further amplifies the need for robust communication systems. As a result, electricity utilities will remain the largest contributors to the utility communication market, continuously driving innovations in communication technologies to support grid modernization and sustainable energy practices.
Cloud-Based Deployment Mode Segment Is Fastest Growing Due to Cost Efficiency and Scalability
The cloud-based deployment mode is the fastest-growing segment in the utility communication market, attributed to its cost efficiency, scalability, and flexibility. Cloud-based solutions allow utilities to manage and analyze large volumes of data generated by smart meters, sensors, and communication systems without the need for costly infrastructure investments. The ability to access data in real-time, scale operations based on demand, and benefit from reduced maintenance costs has made cloud-based deployment increasingly attractive to utility companies.
Incorporating cloud technologies into utility communication systems facilitates seamless integration with other systems, such as enterprise resource planning (ERP) and customer relationship management (CRM). Cloud-based systems also enhance collaboration among various departments and enable more efficient decision-making, driving operational efficiency and customer satisfaction. As the demand for smart grid solutions, remote monitoring, and automation continues to grow, the cloud-based deployment mode will play a key role in supporting the scalability and agility of utility communication systems.
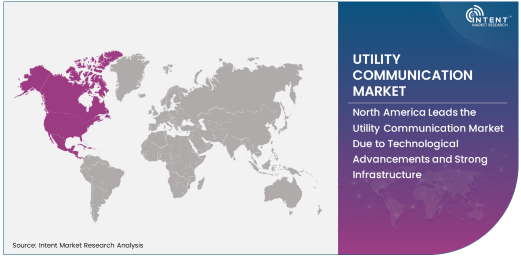
North America Leads the Utility Communication Market Due to Technological Advancements and Strong Infrastructure
North America is the largest region in the utility communication market, driven by technological advancements, strong infrastructure, and a growing focus on smart grids and automation. The United States and Canada are at the forefront of deploying smart grid technologies, advanced metering infrastructure, and energy management solutions, positioning North America as the leader in utility communication. Both countries have implemented comprehensive regulatory frameworks to support the development and integration of smart grid technologies, promoting energy efficiency and grid reliability.
The increasing focus on renewable energy sources, grid modernization, and environmental sustainability has led to greater investments in communication systems that support these initiatives. Furthermore, North America's robust telecommunications infrastructure and high penetration of wireless technologies have facilitated the widespread adoption of wireless communication solutions in utility networks. As a result, North America is expected to continue to dominate the utility communication market, with utilities investing heavily in communication infrastructure to meet the evolving demands of modern energy systems.
Competitive Landscape: Key Players Focus on Technological Innovation and Strategic Partnerships
The utility communication market is highly competitive, with major players such as Cisco Systems, Siemens, General Electric, and Honeywell leading the way in offering innovative solutions. These companies focus on developing advanced communication systems that integrate seamlessly with smart grid technologies, metering infrastructure, and automation systems. Strategic partnerships, collaborations with utilities, and acquisitions are key strategies employed by these companies to strengthen their market position and expand their product portfolios.
In addition to large technology providers, specialized communication solution providers are gaining traction by offering tailored solutions for utilities, including power line communication (PLC) and radio frequency (RF) technologies. As the demand for smart grid solutions and real-time data analytics continues to rise, competition will intensify, pushing companies to innovate and deliver reliable, cost-effective communication solutions that support the modernization of utility networks across the globe.
Recent Developments:
- In December 2024, Siemens AG launched a new smart grid communication platform, enabling enhanced interoperability and data exchange across multiple utility sectors.
- In November 2024, Cisco Systems partnered with Itron to integrate advanced networking solutions into smart metering systems, enhancing data transmission efficiency.
- In October 2024, Honeywell announced the expansion of its utility communication portfolio with a new demand response communication solution aimed at improving grid flexibility.
- In September 2024, ABB Group acquired a major utility communication technology provider to strengthen its portfolio of smart grid solutions.
- In August 2024, Schneider Electric launched a new suite of communication protocols for power line communication, aiming to improve connectivity in remote utility locations.
List of Leading Companies:
- Siemens AG
- General Electric Company
- Cisco Systems, Inc.
- ABB Group
- Honeywell International Inc.
- Schneider Electric
- Landis+Gyr
- Itron, Inc.
- Elster Group (Honeywell)
- Sensus (Xylem Inc.)
- Aclara Technologies
- Trilliant Networks
- Ametek, Inc.
- Ericsson
- Nokia Networks
Report Scope:
|
Report Features |
Description |
|
Market Size (2024-e) |
USD 25.6 Billion |
|
Forecasted Value (2030) |
USD 44.7 Billion |
|
CAGR (2025 – 2030) |
8.3% |
|
Base Year for Estimation |
2024-e |
|
Historic Year |
2023 |
|
Forecast Period |
2025 – 2030 |
|
Report Coverage |
Market Forecast, Market Dynamics, Competitive Landscape, Recent Developments |
|
Segments Covered |
Utility Communication Market by Communication Technology (Wired Communication, Wireless Communication), End-User (Utilities (Electricity), Water Utilities, Gas Utilities), Application (Smart Grids, Metering Systems, Distribution Automation, Demand Response Systems, Other Applications), Deployment Mode (On-Premise, Cloud-Based), Component (Hardware, Software, Services), Communication Protocol (Power Line Communication (PLC), Radio Frequency (RF), Cellular Networks, Optical Fiber), Distribution Channel (Direct Sales, Channel Partners, Online Retailers, Others) |
|
Regional Analysis |
North America (US, Canada, Mexico), Europe (Germany, France, UK, Italy, Spain, and Rest of Europe), Asia-Pacific (China, Japan, South Korea, Australia, India, and Rest of Asia-Pacific), Latin America (Brazil, Argentina, and Rest of Latin America), Middle East & Africa (Saudi Arabia, UAE, Rest of Middle East & Africa) |
|
Major Companies |
Siemens AG, General Electric Company, Cisco Systems, Inc., ABB Group, Honeywell International Inc., Schneider Electric, Landis+Gyr, Itron, Inc., Elster Group (Honeywell), Sensus (Xylem Inc.), Aclara Technologies, Trilliant Networks, Ametek, Inc., Ericsson, Nokia Networks |
|
Customization Scope |
Customization for segments, region/country-level will be provided. Moreover, additional customization can be done based on the requirements |
|
1. Introduction |
|
1.1. Market Definition |
|
1.2. Scope of the Study |
|
1.3. Research Assumptions |
|
1.4. Study Limitations |
|
2. Research Methodology |
|
2.1. Research Approach |
|
2.1.1. Top-Down Method |
|
2.1.2. Bottom-Up Method |
|
2.1.3. Factor Impact Analysis |
|
2.2. Insights & Data Collection Process |
|
2.2.1. Secondary Research |
|
2.2.2. Primary Research |
|
2.3. Data Mining Process |
|
2.3.1. Data Analysis |
|
2.3.2. Data Validation and Revalidation |
|
2.3.3. Data Triangulation |
|
3. Executive Summary |
|
3.1. Major Markets & Segments |
|
3.2. Highest Growing Regions and Respective Countries |
|
3.3. Impact of Growth Drivers & Inhibitors |
|
3.4. Regulatory Overview by Country |
|
4. Utility Communication Market, by Communication Technology (Market Size & Forecast: USD Million, 2023 – 2030) |
|
4.1. Wired Communication |
|
4.2. Wireless Communication |
|
5. Utility Communication Market, by End-User (Market Size & Forecast: USD Million, 2023 – 2030) |
|
5.1. Utilities (Electricity) |
|
5.2. Water Utilities |
|
5.3. Gas Utilities |
|
6. Utility Communication Market, by Application (Market Size & Forecast: USD Million, 2023 – 2030) |
|
6.1. Smart Grids |
|
6.2. Metering Systems |
|
6.3. Distribution Automation |
|
6.4. Demand Response Systems |
|
6.5. Other Applications |
|
7. Utility Communication Market, by Deployment Mode (Market Size & Forecast: USD Million, 2023 – 2030) |
|
7.1. On-Premise |
|
7.2. Cloud-Based |
|
8. Utility Communication Market, by Component (Market Size & Forecast: USD Million, 2023 – 2030) |
|
8.1. Hardware |
|
8.2. Software |
|
8.3. Services |
|
9. Utility Communication Market, by Communication Protocol (Market Size & Forecast: USD Million, 2023 – 2030) |
|
9.1. Power Line Communication (PLC) |
|
9.2. Radio Frequency (RF) |
|
9.3. Cellular Networks |
|
9.4. Optical Fiber |
|
10. Utility Communication Market, by Distribution Channel (Market Size & Forecast: USD Million, 2023 – 2030) |
|
10.1. Direct Sales |
|
10.2. Channel Partners |
|
10.3. Online Retailers |
|
10.4. Others |
|
11. Regional Analysis (Market Size & Forecast: USD Million, 2023 – 2030) |
|
11.1. Regional Overview |
|
11.2. North America |
|
11.2.1. Regional Trends & Growth Drivers |
|
11.2.2. Barriers & Challenges |
|
11.2.3. Opportunities |
|
11.2.4. Factor Impact Analysis |
|
11.2.5. Technology Trends |
|
11.2.6. North America Utility Communication Market, by Communication Technology |
|
11.2.7. North America Utility Communication Market, by End-User |
|
11.2.8. North America Utility Communication Market, by Application |
|
11.2.9. North America Utility Communication Market, by Deployment Mode |
|
11.2.10. North America Utility Communication Market, by Component |
|
11.2.11. North America Utility Communication Market, by Communication Protocol |
|
11.2.12. North America Utility Communication Market, by Distribution Channel |
|
11.2.13. By Country |
|
11.2.13.1. US |
|
11.2.13.1.1. US Utility Communication Market, by Communication Technology |
|
11.2.13.1.2. US Utility Communication Market, by End-User |
|
11.2.13.1.3. US Utility Communication Market, by Application |
|
11.2.13.1.4. US Utility Communication Market, by Deployment Mode |
|
11.2.13.1.5. US Utility Communication Market, by Component |
|
11.2.13.1.6. US Utility Communication Market, by Communication Protocol |
|
11.2.13.1.7. US Utility Communication Market, by Distribution Channel |
|
11.2.13.2. Canada |
|
11.2.13.3. Mexico |
|
*Similar segmentation will be provided for each region and country |
|
11.3. Europe |
|
11.4. Asia-Pacific |
|
11.5. Latin America |
|
11.6. Middle East & Africa |
|
12. Competitive Landscape |
|
12.1. Overview of the Key Players |
|
12.2. Competitive Ecosystem |
|
12.2.1. Level of Fragmentation |
|
12.2.2. Market Consolidation |
|
12.2.3. Product Innovation |
|
12.3. Company Share Analysis |
|
12.4. Company Benchmarking Matrix |
|
12.4.1. Strategic Overview |
|
12.4.2. Product Innovations |
|
12.5. Start-up Ecosystem |
|
12.6. Strategic Competitive Insights/ Customer Imperatives |
|
12.7. ESG Matrix/ Sustainability Matrix |
|
12.8. Manufacturing Network |
|
12.8.1. Locations |
|
12.8.2. Supply Chain and Logistics |
|
12.8.3. Product Flexibility/Customization |
|
12.8.4. Digital Transformation and Connectivity |
|
12.8.5. Environmental and Regulatory Compliance |
|
12.9. Technology Readiness Level Matrix |
|
12.10. Technology Maturity Curve |
|
12.11. Buying Criteria |
|
13. Company Profiles |
|
13.1. Siemens AG |
|
13.1.1. Company Overview |
|
13.1.2. Company Financials |
|
13.1.3. Product/Service Portfolio |
|
13.1.4. Recent Developments |
|
13.1.5. IMR Analysis |
|
*Similar information will be provided for other companies |
|
13.2. General Electric Company |
|
13.3. Cisco Systems, Inc. |
|
13.4. ABB Group |
|
13.5. Honeywell International Inc. |
|
13.6. Schneider Electric |
|
13.7. Landis+Gyr |
|
13.8. Itron, Inc. |
|
13.9. Elster Group (Honeywell) |
|
13.10. Sensus (Xylem Inc.) |
|
13.11. Aclara Technologies |
|
13.12. Trilliant Networks |
|
13.13. Ametek, Inc. |
|
13.14. Ericsson |
|
13.15. Nokia Networks |
|
14. Appendix |
A comprehensive market research approach was employed to gather and analyze data on the Utility Communication Market. In the process, the analysis was also done to analyze the parent market and relevant adjacencies to measure the impact of them on the Utility Communication Market. The research methodology encompassed both secondary and primary research techniques, ensuring the accuracy and credibility of the findings.
.jpg)
Secondary Research
Secondary research involved a thorough review of pertinent industry reports, journals, articles, and publications. Additionally, annual reports, press releases, and investor presentations of industry players were scrutinized to gain insights into their market positioning and strategies.
Primary Research
Primary research involved conducting in-depth interviews with industry experts, stakeholders, and market participants across the E-Waste Management ecosystem. The primary research objectives included:
- Validating findings and assumptions derived from secondary research
- Gathering qualitative and quantitative data on market trends, drivers, and challenges
- Understanding the demand-side dynamics, encompassing end-users, component manufacturers, facility providers, and service providers
- Assessing the supply-side landscape, including technological advancements and recent developments
Market Size Assessment
A combination of top-down and bottom-up approaches was utilized to analyze the overall size of the Utility Communication Market. These methods were also employed to assess the size of various subsegments within the market. The market size assessment methodology encompassed the following steps:
- Identification of key industry players and relevant revenues through extensive secondary research
- Determination of the industry's supply chain and market size, in terms of value, through primary and secondary research processes
- Calculation of percentage shares, splits, and breakdowns using secondary sources and verification through primary sources
.jpg)
Data Triangulation
To ensure the accuracy and reliability of the market size, data triangulation was implemented. This involved cross-referencing data from various sources, including demand and supply side factors, market trends, and expert opinions. Additionally, top-down and bottom-up approaches were employed to validate the market size assessment.
NA