As per Intent Market Research, the Used Truck Market was valued at USD 46.4 billion in 2024-e and will surpass USD 61.1 billion by 2030; growing at a CAGR of 4.0% during 2025 - 2030.
The global truck market is experiencing robust growth, driven by the increasing demand for transportation and logistics services across various industries. Trucks play a critical role in the movement of goods, from light-duty vehicles used for urban deliveries to heavy-duty trucks employed for long-haul freight. As the market expands, factors such as the rise of e-commerce, infrastructure development, and the shift towards more sustainable fuel options are shaping the dynamics of truck sales and purchases. The market is highly segmented, with trucks varying by type, fuel source, vehicle age, and condition, offering a wide array of options for different customer needs.
A key trend within the truck market is the growing interest in electric and hybrid trucks, driven by stricter emission regulations and the push for greener logistics solutions. Furthermore, the increasing adoption of online platforms for purchasing trucks, along with the expansion of certified pre-owned (CPO) programs, has reshaped the way buyers and fleet operators approach truck acquisition. This has resulted in a highly competitive market with diverse offerings catering to different end-users, from fleet operators to individual buyers.
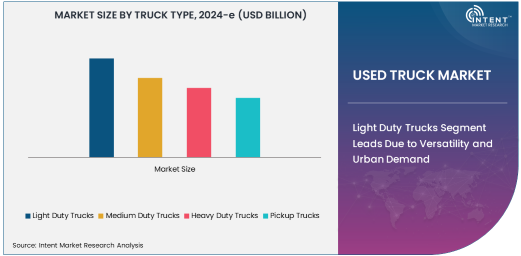
Light Duty Trucks Segment Leads Due to Versatility and Urban Demand
The light-duty trucks segment dominates the market due to their versatility, fuel efficiency, and suitability for urban deliveries. These vehicles are ideal for small businesses, delivery services, and personal use, as they offer a balance between payload capacity and maneuverability in congested city environments. The increasing demand for last-mile delivery services, driven by the e-commerce boom, has particularly boosted the sales of light-duty trucks. These trucks are also gaining popularity due to their lower operational costs compared to medium and heavy-duty trucks, making them attractive for small and medium enterprises (SMEs) that require cost-effective solutions.
In addition to their role in the logistics industry, light-duty trucks are increasingly being used for non-commercial purposes, such as recreation and personal transportation. This versatility makes them the go-to choice for a wide range of consumers, from individual buyers to fleet operators. As urbanization continues to rise globally, the demand for light-duty trucks is expected to maintain its leading position in the truck market.
Electric Trucks Segment is Fastest Growing Driven by Sustainability Demands
The electric trucks segment is the fastest growing in the market, as sustainability becomes a top priority for businesses and governments alike. With stricter environmental regulations and increasing concerns over air pollution, electric trucks are seen as a key solution for reducing carbon emissions in the transportation and logistics sectors. Companies are increasingly investing in electric trucks to align with sustainability goals and to take advantage of government incentives and subsidies designed to promote green transportation.
Electric trucks, particularly in the light-duty and medium-duty categories, are experiencing rapid adoption, especially for urban deliveries where lower emissions are a critical consideration. In addition, advancements in battery technology, improved range, and growing charging infrastructure are making electric trucks a more viable option for fleet operators. As a result, this segment is projected to experience significant growth, with electric trucks expected to play a pivotal role in the future of the global truck market.
Certified Pre-Owned (CPO) Trucks Are Most Preferred Due to Assurance of Quality and Reliability
Certified Pre-Owned (CPO) trucks are increasingly becoming the most sought-after condition type in the truck market, especially among fleet operators and small businesses looking for a balance between affordability and reliability. CPO programs provide a level of quality assurance, as these trucks undergo thorough inspections, repairs, and certifications by authorized dealers. Buyers are drawn to CPO trucks due to their lower upfront costs compared to new trucks, while still benefiting from warranties and extended service packages.
For businesses, the CPO option offers an excellent way to expand or refresh fleets without the significant financial burden associated with purchasing new trucks. These vehicles also provide peace of mind regarding their condition and reliability, making them an attractive option for operators who rely on their trucks for daily operations. The growing popularity of CPO trucks is expected to continue, particularly in markets where cost efficiency and vehicle longevity are key priorities.
Fleet Operators Segment Leads the Market Due to High Volume of Purchases
The fleet operators segment is the largest end-user category in the truck market, driven by the high volume of truck purchases required to meet the logistics and transportation needs of businesses. Fleet operators require large numbers of trucks to manage distribution, logistics, and supply chain functions. Whether for long-haul freight, regional deliveries, or local transportation, fleet operators rely heavily on trucks to maintain business continuity and efficiency. These buyers typically prefer bulk purchases, often opting for trucks that offer high durability and low operational costs.
The demand from fleet operators is further bolstered by the expansion of e-commerce and the increasing demand for goods transportation, which requires robust logistics networks. The ongoing digital transformation of the trucking industry, with tools for route optimization, fleet management, and telematics, has also made it easier for fleet operators to monitor and maintain their trucks, further driving the need for reliable and efficient vehicles. As such, fleet operators remain the dominant end-users in the truck market, ensuring consistent demand for both new and used vehicles.
Online Platforms Segment Is Fastest Growing Distribution Channel Due to Convenience and Digitalization
The online platforms segment is the fastest growing distribution channel in the truck market, reflecting the growing trend of e-commerce and the digitalization of vehicle sales. Online marketplaces and digital platforms provide a convenient way for buyers to browse and purchase trucks from the comfort of their homes or offices. This shift toward online transactions is especially evident in the used truck market, where buyers can access detailed vehicle listings, compare prices, and even schedule inspections and financing options through digital channels.
The growth of online truck sales platforms is further supported by the increasing availability of virtual showrooms, augmented reality tools, and user-friendly interfaces that facilitate the buying process. In addition, the rise of online auctions has made it easier for buyers to source vehicles at competitive prices. As consumer confidence in online vehicle purchases continues to grow, the online platforms segment is expected to see sustained expansion, reshaping how trucks are bought and sold in the market.
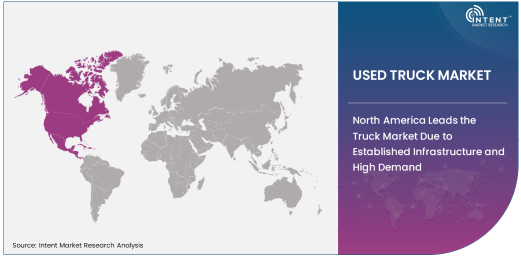
North America Leads the Truck Market Due to Established Infrastructure and High Demand
North America is the leading region in the truck market, driven by the high demand for both light and heavy-duty trucks and the established infrastructure that supports truck sales and distribution. The region has a large number of fleet operators, small businesses, and individual buyers, all of whom contribute to the consistent demand for trucks across various categories. Additionally, North America is a key hub for the development and adoption of electric trucks, as governments in the United States and Canada continue to push for sustainability through incentives and infrastructure investment.
The strong presence of major truck manufacturers, including Ford, General Motors, and Freightliner, coupled with a well-developed network of dealerships, online platforms, and service providers, makes North America a dominant force in the global truck market. As the region continues to focus on green initiatives and technological advancements, North America is expected to maintain its leadership in the truck market for the foreseeable future.
Competitive Landscape: Key Players Drive Innovation and Market Share
The truck market is highly competitive, with several key players vying for market share through innovation, strategic partnerships, and expanded offerings. Major truck manufacturers such as Daimler AG, Volvo Group, PACCAR, and Toyota dominate the market, with a wide range of products catering to different segments, from light-duty trucks to heavy-duty freight vehicles. These companies are increasingly focusing on developing electric and hybrid trucks to meet the growing demand for sustainable transportation solutions.
In addition to traditional truck manufacturers, online platforms and digital marketplaces such as Autotrader, Trucks.com, and commercial vehicle auction sites are playing an increasingly significant role in shaping the distribution landscape. With advancements in telematics, autonomous driving technologies, and electric powertrains, leading players in the truck market are positioning themselves at the forefront of innovation to meet evolving customer demands and remain competitive in the market.
Recent Developments:
- In December 2024, PACCAR announced a new digital platform for used truck sales, enabling buyers to browse, inspect, and finance trucks online.
- In November 2024, Volvo Group expanded its used truck dealership network across North America to cater to the growing demand for pre-owned trucks.
- In October 2024, Daimler AG launched a certified pre-owned truck program to ensure higher quality standards and enhance customer satisfaction in the used truck market.
- In September 2024, Ford Motor Company introduced new warranties for its used trucks, aiming to boost customer confidence and sales.
- In August 2024, Tata Motors opened several used truck dealerships in rural India to increase the availability of affordable commercial vehicles for small businesses.
List of Leading Companies:
- Volvo Group
- Daimler AG (Mercedes-Benz)
- Ford Motor Company
- General Motors (Chevrolet, GMC)
- PACCAR Inc. (Kenworth, Peterbilt)
- MAN Truck & Bus
- Scania AB
- Isuzu Motors Ltd.
- Hino Motors Ltd.
- Mitsubishi Fuso Truck and Bus Corporation
- Navistar International Corporation
- Iveco S.p.A.
- Tata Motors Limited
- Renault Trucks
- Daimler Trucks North America
Report Scope:
|
Report Features |
Description |
|
Market Size (2024-e) |
USD 46.4 Billion |
|
Forecasted Value (2030) |
USD 61.1 Billion |
|
CAGR (2025 – 2030) |
4.0% |
|
Base Year for Estimation |
2024-e |
|
Historic Year |
2023 |
|
Forecast Period |
2025 – 2030 |
|
Report Coverage |
Market Forecast, Market Dynamics, Competitive Landscape, Recent Developments |
|
Segments Covered |
Truck Market by Truck Type (Light Duty Trucks, Medium Duty Trucks, Heavy Duty Trucks, Pickup Trucks), Fuel Type (Diesel, Petrol, Electric, Hybrid), Age of Vehicle (Less than 3 Years, 3 to 5 Years, 5 to 10 Years, More than 10 Years), Condition (Certified Pre-Owned (CPO), Non-Certified), End-User (Fleet Operators, Small and Medium Enterprises (SMEs), Individual Buyers, Truck Dealers and Resellers), Distribution Channel (Online Platforms, Dealerships, Auctions, Others) |
|
Regional Analysis |
North America (US, Canada, Mexico), Europe (Germany, France, UK, Italy, Spain, and Rest of Europe), Asia-Pacific (China, Japan, South Korea, Australia, India, and Rest of Asia-Pacific), Latin America (Brazil, Argentina, and Rest of Latin America), Middle East & Africa (Saudi Arabia, UAE, Rest of Middle East & Africa) |
|
Major Companies |
Volvo Group, Daimler AG (Mercedes-Benz), Ford Motor Company, General Motors (Chevrolet, GMC), PACCAR Inc. (Kenworth, Peterbilt), MAN Truck & Bus, Scania AB, Isuzu Motors Ltd., Hino Motors Ltd., Mitsubishi Fuso Truck and Bus Corporation, Navistar International Corporation, Iveco S.p.A., Tata Motors Limited, Renault Trucks, Daimler Trucks North America |
|
Customization Scope |
Customization for segments, region/country-level will be provided. Moreover, additional customization can be done based on the requirements |
|
1. Introduction |
|
1.1. Market Definition |
|
1.2. Scope of the Study |
|
1.3. Research Assumptions |
|
1.4. Study Limitations |
|
2. Research Methodology |
|
2.1. Research Approach |
|
2.1.1. Top-Down Method |
|
2.1.2. Bottom-Up Method |
|
2.1.3. Factor Impact Analysis |
|
2.2. Insights & Data Collection Process |
|
2.2.1. Secondary Research |
|
2.2.2. Primary Research |
|
2.3. Data Mining Process |
|
2.3.1. Data Analysis |
|
2.3.2. Data Validation and Revalidation |
|
2.3.3. Data Triangulation |
|
3. Executive Summary |
|
3.1. Major Markets & Segments |
|
3.2. Highest Growing Regions and Respective Countries |
|
3.3. Impact of Growth Drivers & Inhibitors |
|
3.4. Regulatory Overview by Country |
|
4. Used Trucks Market, by Truck Type (Market Size & Forecast: USD Million, 2023 – 2030) |
|
4.1. Light Duty Trucks |
|
4.2. Medium Duty Trucks |
|
4.3. Heavy Duty Trucks |
|
4.4. Pickup Trucks |
|
5. Used Trucks Market, by Fuel Type (Market Size & Forecast: USD Million, 2023 – 2030) |
|
5.1. Diesel |
|
5.2. Petrol |
|
5.3. Electric |
|
5.4. Hybrid |
|
6. Used Trucks Market, by Age of Vehicle (Market Size & Forecast: USD Million, 2023 – 2030) |
|
6.1. Less than 3 Years |
|
6.2. 3 to 5 Years |
|
6.3. 5 to 10 Years |
|
6.4. More than 10 Years |
|
7. Used Trucks Market, by Condition (Market Size & Forecast: USD Million, 2023 – 2030) |
|
7.1. Certified Pre-Owned (CPO) |
|
7.2. Non-Certified |
|
8. Used Trucks Market, by End-User (Market Size & Forecast: USD Million, 2023 – 2030) |
|
8.1. Fleet Operators |
|
8.2. Small and Medium Enterprises (SMEs) |
|
8.3. Individual Buyers |
|
8.4. Truck Dealers and Resellers |
|
9. Used Trucks Market, by Distribution Channel (Market Size & Forecast: USD Million, 2023 – 2030) |
|
9.1. Online Platforms |
|
9.2. Dealerships |
|
9.3. Auctions |
|
9.4. Others |
|
10. Regional Analysis (Market Size & Forecast: USD Million, 2023 – 2030) |
|
10.1. Regional Overview |
|
10.2. North America |
|
10.2.1. Regional Trends & Growth Drivers |
|
10.2.2. Barriers & Challenges |
|
10.2.3. Opportunities |
|
10.2.4. Factor Impact Analysis |
|
10.2.5. Technology Trends |
|
10.2.6. North America Used Trucks Market, by Truck Type |
|
10.2.7. North America Used Trucks Market, by Fuel Type |
|
10.2.8. North America Used Trucks Market, by Age of Vehicle |
|
10.2.9. North America Used Trucks Market, by Condition |
|
10.2.10. North America Used Trucks Market, by Distribution Channel |
|
10.2.11. By Country |
|
10.2.11.1. US |
|
10.2.11.1.1. US Used Trucks Market, by Truck Type |
|
10.2.11.1.2. US Used Trucks Market, by Fuel Type |
|
10.2.11.1.3. US Used Trucks Market, by Age of Vehicle |
|
10.2.11.1.4. US Used Trucks Market, by Condition |
|
10.2.11.1.5. US Used Trucks Market, by Distribution Channel |
|
10.2.11.2. Canada |
|
10.2.11.3. Mexico |
|
*Similar segmentation will be provided for each region and country |
|
10.3. Europe |
|
10.4. Asia-Pacific |
|
10.5. Latin America |
|
10.6. Middle East & Africa |
|
11. Competitive Landscape |
|
11.1. Overview of the Key Players |
|
11.2. Competitive Ecosystem |
|
11.2.1. Level of Fragmentation |
|
11.2.2. Market Consolidation |
|
11.2.3. Product Innovation |
|
11.3. Company Share Analysis |
|
11.4. Company Benchmarking Matrix |
|
11.4.1. Strategic Overview |
|
11.4.2. Product Innovations |
|
11.5. Start-up Ecosystem |
|
11.6. Strategic Competitive Insights/ Customer Imperatives |
|
11.7. ESG Matrix/ Sustainability Matrix |
|
11.8. Manufacturing Network |
|
11.8.1. Locations |
|
11.8.2. Supply Chain and Logistics |
|
11.8.3. Product Flexibility/Customization |
|
11.8.4. Digital Transformation and Connectivity |
|
11.8.5. Environmental and Regulatory Compliance |
|
11.9. Technology Readiness Level Matrix |
|
11.10. Technology Maturity Curve |
|
11.11. Buying Criteria |
|
12. Company Profiles |
|
12.1. Volvo Group |
|
12.1.1. Company Overview |
|
12.1.2. Company Financials |
|
12.1.3. Product/Service Portfolio |
|
12.1.4. Recent Developments |
|
12.1.5. IMR Analysis |
|
*Similar information will be provided for other companies |
|
12.2. Daimler AG (Mercedes-Benz) |
|
12.3. Ford Motor Company |
|
12.4. General Motors (Chevrolet, GMC) |
|
12.5. PACCAR Inc. (Kenworth, Peterbilt) |
|
12.6. MAN Truck & Bus |
|
12.7. Scania AB |
|
12.8. Isuzu Motors Ltd. |
|
12.9. Hino Motors Ltd. |
|
12.10. Mitsubishi Fuso Truck and Bus Corporation |
|
12.11. Navistar International Corporation |
|
12.12. Iveco S.p.A. |
|
12.13. Tata Motors Limited |
|
12.14. Renault Trucks |
|
12.15. Daimler Trucks North America |
|
13. Appendix |
A comprehensive market research approach was employed to gather and analyze data on the Used Truck Market. In the process, the analysis was also done to analyze the parent market and relevant adjacencies to measure the impact of them on the Used Truck Market. The research methodology encompassed both secondary and primary research techniques, ensuring the accuracy and credibility of the findings.
.jpg)
Secondary Research
Secondary research involved a thorough review of pertinent industry reports, journals, articles, and publications. Additionally, annual reports, press releases, and investor presentations of industry players were scrutinized to gain insights into their market positioning and strategies.
Primary Research
Primary research involved conducting in-depth interviews with industry experts, stakeholders, and market participants across the E-Waste Management ecosystem. The primary research objectives included:
- Validating findings and assumptions derived from secondary research
- Gathering qualitative and quantitative data on market trends, drivers, and challenges
- Understanding the demand-side dynamics, encompassing end-users, component manufacturers, facility providers, and service providers
- Assessing the supply-side landscape, including technological advancements and recent developments
Market Size Assessment
A combination of top-down and bottom-up approaches was utilized to analyze the overall size of the Used Truck Market. These methods were also employed to assess the size of various subsegments within the market. The market size assessment methodology encompassed the following steps:
- Identification of key industry players and relevant revenues through extensive secondary research
- Determination of the industry's supply chain and market size, in terms of value, through primary and secondary research processes
- Calculation of percentage shares, splits, and breakdowns using secondary sources and verification through primary sources
.jpg)
Data Triangulation
To ensure the accuracy and reliability of the market size, data triangulation was implemented. This involved cross-referencing data from various sources, including demand and supply side factors, market trends, and expert opinions. Additionally, top-down and bottom-up approaches were employed to validate the market size assessment.
NA