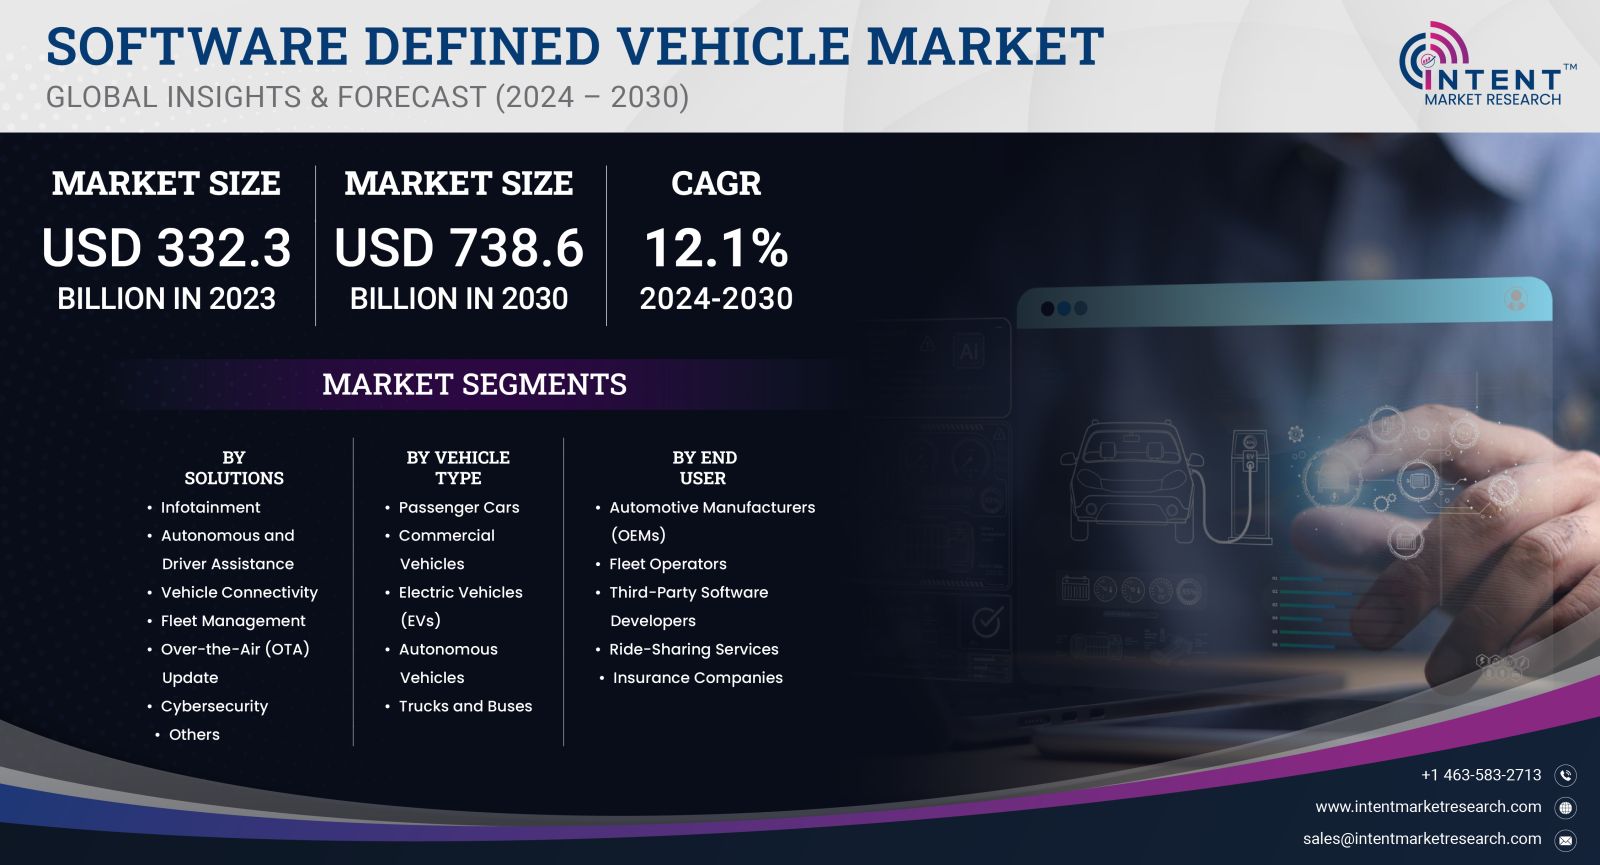
As per Intent Market Research, the Software Defined Vehicle Market was valued at USD 332.3 billion in 2023 and will surpass USD 738.6 billion by 2030; growing at a CAGR of 12.1% during 2024 - 2030.
The Software Defined Vehicle (SDV) market is a rapidly evolving sector that leverages software to control vehicle functionalities, enhancing performance, safety, and user experience. As traditional automotive frameworks give way to advanced software-driven technologies, the SDV market is projected to witness significant growth in the coming years. This transformation is driven by the increasing demand for electric vehicles (EVs), autonomous driving technologies, and the integration of connected services that enhance vehicle performance and user engagement.
The rapid integration of advanced driver-assistance systems (ADAS), Internet of Things (IoT) capabilities, and over-the-air (OTA) updates is paving the way for a new era of vehicle innovation. This shift is further fueled by the growing emphasis on safety, environmental sustainability, and enhanced consumer experience. With major automotive manufacturers and tech companies investing heavily in software capabilities, the SDV market is poised for a transformative journey, positioning itself as a cornerstone of the future automotive ecosystem.
Autonomous Driving Segment is Fastest Growing Owing to Advancements in AI Technologies
The autonomous driving segment within the SDV market is experiencing exponential growth, driven by rapid advancements in artificial intelligence (AI) technologies. This sub-segment focuses on the development of self-driving capabilities that allow vehicles to navigate without human intervention. The integration of AI enables vehicles to process vast amounts of data in real time, facilitating safer and more efficient driving experiences.
Key players in this sub-segment are heavily investing in research and development to enhance the capabilities of autonomous vehicles. The rise of Level 4 and Level 5 automation, where vehicles can operate autonomously under certain conditions, is significantly driving innovation. Companies are also collaborating with technology firms to integrate sophisticated machine learning algorithms that improve perception and decision-making processes, paving the way for the widespread adoption of autonomous driving technologies in the coming years.
Electric Vehicles Segment is Largest Owing to Rising Environmental Concerns
The electric vehicles (EVs) segment represents the largest sub-segment within the Software Defined Vehicle market, primarily due to increasing environmental concerns and government incentives promoting sustainable transportation solutions. As global awareness of climate change and pollution rises, consumers are increasingly seeking alternatives to traditional combustion engine vehicles.
Major automotive manufacturers are investing heavily in electrification strategies, with many pledging to transition their fleets to electric by the end of the decade. The integration of software in EVs enhances their functionality, enabling features such as regenerative braking, real-time battery management, and vehicle-to-grid (V2G) capabilities. This shift not only aligns with consumer demands for sustainable solutions but also supports governmental policies aimed at reducing carbon emissions, solidifying the electric vehicle sub-segment as a key player in the Software Defined Vehicle market.
Connected Vehicle Segment is Largest Owing to Enhanced Consumer Experience
The connected vehicle segment of the Software Defined Vehicle market is significant due to its potential to revolutionize the user experience through advanced connectivity features. This sub-segment focuses on integrating internet connectivity into vehicles, enabling a range of services such as real-time traffic updates, remote diagnostics, and in-car infotainment systems. The connected vehicle segment is being propelled by the increasing demand for seamless connectivity and enhanced consumer experiences.
Automakers are increasingly investing in software that enhances vehicle connectivity, leading to the development of applications that provide drivers with valuable insights into their vehicle's performance and maintenance needs. Moreover, connected vehicle technology is integral to the implementation of smart city initiatives, where vehicles communicate with infrastructure to improve traffic flow and safety. As consumer expectations continue to rise, the connected vehicle segment is well-positioned to capitalize on this trend, driving further innovation in the Software Defined Vehicle market.
Cloud-Based Services Segment is Fastest Growing Owing to Scalability and Flexibility
The cloud-based services segment within the Software Defined Vehicle market is the fastest growing, attributed to the scalability and flexibility that cloud solutions offer to automotive manufacturers. This sub-segment enables the storage and processing of vast amounts of data generated by vehicles, facilitating the deployment of software updates and new features in real time. cloud-based services are becoming increasingly essential for the development and maintenance of software-defined vehicles.
Cloud technologies allow automotive companies to manage data more effectively, providing insights that enhance vehicle performance and user experience. Additionally, the ability to perform over-the-air (OTA) updates ensures that vehicles remain up-to-date with the latest software and security patches without requiring physical visits to service centers. As the automotive industry continues to embrace digital transformation, the cloud-based services segment is set to play a crucial role in the evolution of the Software Defined Vehicle market.
Asia Pacific Region is Largest Owing to Strong Manufacturing Base
The Asia Pacific region is the largest market for Software Defined Vehicles, primarily due to its robust manufacturing base and increasing demand for innovative automotive solutions. Countries such as China, Japan, and South Korea are leading the charge in automotive technology advancements, with significant investments in research and development focused on software integration.
China, in particular, stands out as a global leader in electric vehicle production and adoption, further solidifying its position in the Software Defined Vehicle market. The government's commitment to promoting electric vehicles and autonomous driving technologies has led to a surge in investments from both domestic and international automakers. Additionally, the growing trend of smart city initiatives in the region is facilitating the development of connected vehicles, creating a favorable environment for the Software Defined Vehicle market to thrive.
Competitive Landscape of the Software Defined Vehicle Market
The Software Defined Vehicle market is characterized by intense competition among key players striving to gain a foothold in this rapidly evolving sector. Major companies such as Tesla, General Motors, Ford Motor Company, Volkswagen, and BMW are at the forefront of innovation, continuously investing in advanced software technologies and partnerships to enhance their vehicle offerings. Additionally, technology firms like NVIDIA, Intel, and Qualcomm are also making significant contributions, providing the necessary hardware and software solutions to support the development of software-defined vehicles.
The competitive landscape is marked by strategic collaborations and partnerships aimed at leveraging expertise in software development, data analytics, and cloud computing. Companies are increasingly focusing on research and development to create advanced driver-assistance systems (ADAS) and autonomous driving capabilities, while also enhancing the connected vehicle experience. As the Software Defined Vehicle market continues to grow, the interplay between traditional automakers and technology firms will shape the future of the automotive industry, driving innovation and transforming consumer experiences on the road.
Report Objectives:
The report will help you answer some of the most critical questions in the Software Defined Vehicle Market. A few of them are as follows:
- What are the key drivers, restraints, opportunities, and challenges influencing the market growth?
- What are the prevailing technology trends in the Software Defined Vehicle Market?
- What is the size of the Software Defined Vehicle Market based on segments, sub-segments, and regions?
- What is the size of different market segments across key regions: North America, Europe, Asia-Pacific, Latin America, Middle East & Africa?
- What are the market opportunities for stakeholders after analyzing key market trends?
- Who are the leading market players and what are their market share and core competencies?
- What is the degree of competition in the market and what are the key growth strategies adopted by leading players?
- What is the competitive landscape of the market, including market share analysis, revenue analysis, and a ranking of key players?
Report Scope:
|
Report Features |
Description |
|
Market Size (2023) |
USD 332.3 billion |
|
Forecasted Value (2030) |
USD 738.6 billion |
|
CAGR (2024 – 2030) |
12.1% |
|
Base Year for Estimation |
2023 |
|
Historic Year |
2022 |
|
Forecast Period |
2024 – 2030 |
|
Report Coverage |
Market Forecast, Market Dynamics, Competitive Landscape, Recent Developments |
|
Segments Covered |
Software Defined Vehicle Market By Solution (Infotainment, Autonomous and Driver Assistance, Vehicle Connectivity, Fleet Management, Over-the-Air (OTA) Update, Cybersecurity), By Vehicle Type (Passenger Cars, Commercial Vehicles, Electric Vehicles (EVs), Autonomous Vehicles, Trucks and Buses), By End User (OEMs, Fleet Operators, Third-Party Software Developers, Ride-Sharing Services, Insurance Companies) |
|
Regional Analysis |
North America (US, Canada, Mexico), Europe (Germany, France, UK, Italy, Spain, and Rest of Europe), Asia-Pacific (China, Japan, South Korea, Australia, India, and Rest of Asia-Pacific), Latin America (Brazil, Argentina, and Rest of Latin America), Middle East & Africa (Saudi Arabia, UAE, Rest of Middle East & Africa) |
|
Customization Scope |
Customization for segments, region/country-level will be provided. Moreover, additional customization can be done based on the requirements |
|
1. Introduction |
|
1.1. Market Definition |
|
1.2. Scope of the Study |
|
1.3. Research Assumptions |
|
1.4. Study Limitations |
|
2. Research Methodology |
|
2.1. Research Approach |
|
2.1.1. Top-Down Method |
|
2.1.2. Bottom-Up Method |
|
2.1.3. Factor Impact Analysis |
|
2.2. Insights & Data Collection Process |
|
2.2.1. Secondary Research |
|
2.2.2. Primary Research |
|
2.3. Data Mining Process |
|
2.3.1. Data Analysis |
|
2.3.2. Data Validation and Revalidation |
|
2.3.3. Data Triangulation |
|
3.Executive Summary |
|
3.1. Major Markets & Segments |
|
3.2. Highest Growing Regions and Respective Countries |
|
3.3. Impact of Growth Drivers & Inhibitors |
|
3.4. Regulatory Overview by Country |
|
4. Software Defined Vehicle Market, by Solutions (Market Size & Forecast: USD Million, 2022 – 2030) |
|
4.1. Infotainment |
|
4.2. Autonomous and Driver Assistance |
|
4.3. Vehicle Connectivity |
|
4.4. Fleet Management |
|
4.5. Over-the-Air (OTA) Update |
|
4.6. Cybersecurity |
|
4.7. Others |
|
5. Software Defined Vehicle Market, by Vehicle Type (Market Size & Forecast: USD Million, 2022 – 2030) |
|
5.1. Passenger Cars |
|
5.2. Commercial Vehicles |
|
5.3. Electric Vehicles (EVs) |
|
5.4. Autonomous Vehicles |
|
5.5. Trucks and Buses |
|
6. Software Defined Vehicle Market, by End User (Market Size & Forecast: USD Million, 2022 – 2030) |
|
6.1. Automotive Manufacturers (OEMs) |
|
6.2. Fleet Operators |
|
6.3. Third-Party Software Developers |
|
6.4. Ride-Sharing Services |
|
6.5. Insurance Companies |
|
7. Regional Analysis (Market Size & Forecast: USD Million, 2022 – 2030) |
|
7.1. Regional Overview |
|
7.2. North America |
|
7.2.1. Regional Trends & Growth Drivers |
|
7.2.2. Barriers & Challenges |
|
7.2.3. Opportunities |
|
7.2.4. Factor Impact Analysis |
|
7.2.5. Technology Trends |
|
7.2.6. North America Software Defined Vehicle Market, by Solution |
|
7.2.7. North America Software Defined Vehicle Market, by Vehicle Type |
|
7.2.8. North America Software Defined Vehicle Market, by End User |
|
7.2.9. By Country |
|
7.2.9.1. US |
|
7.2.9.1.1. US Software Defined Vehicle Market, by Solution |
|
7.2.9.1.2. US Software Defined Vehicle Market, by Vehicle Type |
|
7.2.9.1.3. US Software Defined Vehicle Market, by End User |
|
7.2.9.2. Canada |
|
7.2.9.3. Mexico |
|
*Similar segmentation will be provided for each region and country |
|
7.3. Europe |
|
7.4. Asia-Pacific |
|
7.5. Latin America |
|
7.6. Middle East & Africa |
|
8. Competitive Landscape |
|
8.1. Overview of the Key Players |
|
8.2. Competitive Ecosystem |
|
8.2.1. Level of Fragmentation |
|
8.2.2. Market Consolidation |
|
8.2.3. Product Innovation |
|
8.3. Company Share Analysis |
|
8.4. Company Benchmarking Matrix |
|
8.4.1. Strategic Overview |
|
8.4.2. Product Innovations |
|
8.5. Start-up Ecosystem |
|
8.6. Strategic Competitive Insights/ Customer Imperatives |
|
8.7. ESG Matrix/ Sustainability Matrix |
|
8.8. Manufacturing Network |
|
8.8.1. Locations |
|
8.8.2. Supply Chain and Logistics |
|
8.8.3. Product Flexibility/Customization |
|
8.8.4. Digital Transformation and Connectivity |
|
8.8.5. Environmental and Regulatory Compliance |
|
8.9. Technology Readiness Level Matrix |
|
8.10. Technology Maturity Curve |
|
8.11. Buying Criteria |
|
9. Company Profiles |
|
9.1. Aptiv |
|
9.1.1. Company Overview |
|
9.1.2. Company Financials |
|
9.1.3. Product/Service Portfolio |
|
9.1.4. Recent Developments |
|
9.1.5. IMR Analysis |
|
*Similar information will be provided for other companies |
|
9.2. Aurora Innovation |
|
9.3. BMW |
|
9.4. Bosch |
|
9.5. Continental AG |
|
9.6. Ford |
|
9.7. General Motors |
|
9.8. Intel |
|
9.9. Mercedes-Benz |
|
9.10. NVIDIA |
|
9.11. Pioneer |
|
9.12. Qualcomm Technologies |
|
9.13. Tesla |
|
9.14. Volkswagen |
|
9.15. Waymo |
|
10. Appendix |
A comprehensive market research approach was employed to gather and analyze data on the Software Defined Vehicle Market. In the process, the analysis was also done to analyze the parent market and relevant adjacencies to measure the impact of them on the Software Defined Vehicle Market. The research methodology encompassed both secondary and primary research techniques, ensuring the accuracy and credibility of the findings.
.jpg)
Secondary Research
Secondary research involved a thorough review of pertinent industry reports, journals, articles, and publications. Additionally, annual reports, press releases, and investor presentations of industry players were scrutinized to gain insights into their market positioning and strategies.
Primary Research
Primary research involved conducting in-depth interviews with industry experts, stakeholders, and market participants across the Software Defined Vehicle ecosystem. The primary research objectives included:
- Validating findings and assumptions derived from secondary research
- Gathering qualitative and quantitative data on market trends, drivers, and challenges
- Understanding the demand-side dynamics, encompassing end-users, component manufacturers, facility providers, and service providers
- Assessing the supply-side landscape, including technological advancements and recent developments
Market Size Assessment
A combination of top-down and bottom-up approaches was utilized to analyze the overall size of the Software Defined Vehicle Market. These methods were also employed to assess the size of various subsegments within the market. The market size assessment methodology encompassed the following steps:
- Identification of key industry players and relevant revenues through extensive secondary research
- Determination of the industry's supply chain and market size, in terms of value, through primary and secondary research processes
- Calculation of percentage shares, splits, and breakdowns using secondary sources and verification through primary sources
.jpg)
Data Triangulation
To ensure the accuracy and reliability of the market size, data triangulation was implemented. This involved cross-referencing data from various sources, including demand and supply side factors, market trends, and expert opinions. Additionally, top-down and bottom-up approaches were employed to validate the market size assessment.
NA