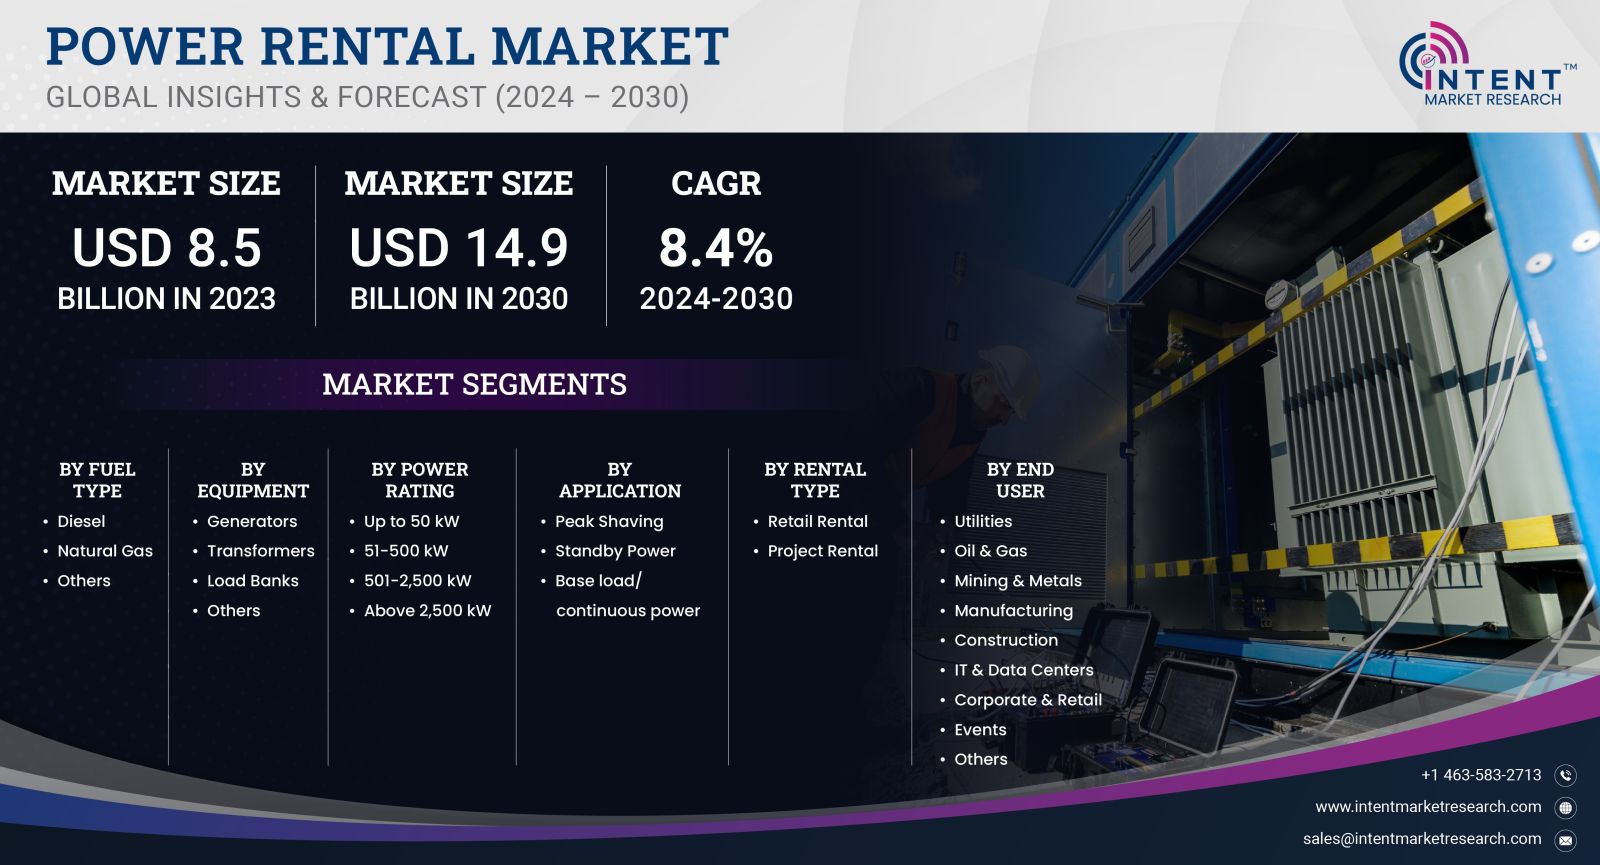
As per Intent Market Research, the Power Rental Market was valued at USD 8.5 billion in 2023 and will surpass USD 14.9 billion by 2030; growing at a CAGR of 8.4% during 2024 - 2030.
The report focuses on estimating the current market potential in terms of the total addressable market for all the segments, sub-segments, and regions. In the process, all the high-growth and upcoming technologies were identified and analyzed to measure their impact on the current and future market. The report also identifies the key stakeholders, their business gaps, and their purchasing behavior. This information is essential for developing effective marketing strategies and creating products or services that meet the needs of the target market. The report also covers a detailed analysis of the competitive landscape which includes major players, their recent developments, growth strategies, product benchmarking, and manufacturing operations among others. Also, brief insights on start-up ecosystem and emerging companies is also included as part of this report.
Report Objectives:
The report will help you answer some of the most critical questions in the Power Rental Market. A few of them are as follows:
- What are the key drivers, restraints, opportunities, and challenges influencing the market growth?
- What are the prevailing technology trends in the Power Rental Market?
- What is the size of the Power Rental Market based on segments, sub-segments, and regions?
- What is the size of different market segments across key regions: North America, Europe, Asia-Pacific, Latin America, Middle East & Africa?
- What are the market opportunities for stakeholders after analyzing key market trends?
- Who are the leading market players and what are their market share and core competencies?
- What is the degree of competition in the market and what are the key growth strategies adopted by leading players?
- What is the competitive landscape of the market, including market share analysis, revenue analysis, and a ranking of key players?
Report Scope:
|
Report Features |
Description |
|
Market Size (2023) |
USD 8.5 billion |
|
Forecasted Value (2030) |
USD 14.9 billion |
|
CAGR (2024 – 2030) |
8.4% |
|
Base Year for Estimation |
2023 |
|
Historic Year |
2022 |
|
Forecast Period |
2024 – 2030 |
|
Report Coverage |
Market Forecast, Market Dynamics, Competitive Landscape, Recent Developments |
|
Segments Covered |
Power Rental Market By Fuel Type (Diesel, Natural Gas), By Equipment (Generators, Transformers, Load Banks), By Power Rating (Up to 50 kW, 51-500 kW, 501-2,500 kW, Above 2,500 kW), By Application (Peak Shaving, Standby Power, Base Load/Continuous Power), By Rental Type (Retail Rental, Project Rental), By End User (Utilities, Oil & Gas, Mining & Metals, Manufacturing, Construction, IT & Data centers, Corporate & Retail, Events) |
|
Regional Analysis |
North America (US, Canada, Mexico), Europe (Germany, France, UK, Italy, Spain, and Rest of Europe), Asia-Pacific (China, Japan, South Korea, Australia, India, and Rest of Asia-Pacific), Latin America (Brazil, Argentina, and Rest of Latin America), Middle East & Africa (Saudi Arabia, UAE, Rest of Middle East & Africa) |
|
Customization Scope |
Customization for segments, region/country-level will be provided. Moreover, additional customization can be done based on the requirements |
|
1. Introduction |
|
1.1. Market Definition |
|
1.2. Scope of the Study |
|
1.3. Research Assumptions |
|
1.4. Study Limitations |
|
2. Research Methodology |
|
2.1. Research Approach |
|
2.1.1. Top-Down Method |
|
2.1.2. Bottom-Up Method |
|
2.1.3. Factor Impact Analysis |
|
2.2. Insights & Data Collection Process |
|
2.2.1. Secondary Research |
|
2.2.2. Primary Research |
|
2.3. Data Mining Process |
|
2.3.1. Data Analysis |
|
2.3.2. Data Validation and Revalidation |
|
2.3.3. Data Triangulation |
|
3.Executive Summary |
|
3.1. Major Markets & Segments |
|
3.2. Highest Growing Regions and Respective Countries |
|
3.3. Impact of Growth Drivers & Inhibitors |
|
3.4. Regulatory Overview by Country |
|
4. Power Rental Market, by Fuel Type (Market Size & Forecast: USD Million, 2022 – 2030) |
|
4.1. Diesel |
|
4.2. Natural Gas |
|
4.3. Others |
|
5. Power Rental Market, by Equipment (Market Size & Forecast: USD Million, 2022 – 2030) |
|
5.1. Generators |
|
5.2. Transformers |
|
5.3. Load Banks |
|
5.4. Others |
|
6. Power Rental Market, by Power Rating (Market Size & Forecast: USD Million, 2022 – 2030) |
|
6.1. Up to 50 kW |
|
6.2. 51-500 kW |
|
6.3. 501-2,500 kW |
|
6.4. Above 2,500 kW |
|
7. Power Rental Market, by Application (Market Size & Forecast: USD Million, 2022 – 2030) |
|
7.1. Peak Shaving |
|
7.2. Standby Power |
|
7.3. Base load/continuous power |
|
8. Power Rental Market, by Rental Type (Market Size & Forecast: USD Million, 2022 – 2030) |
|
8.1. Retail Rental |
|
8.2. Project Rental |
|
9. Power Rental Market, by End User (Market Size & Forecast: USD Million, 2022 – 2030) |
|
9.1. Utilities |
|
9.2. Oil & Gas |
|
9.3. Mining & Metals |
|
9.4. Manufacturing |
|
9.5. Construction |
|
9.6. IT & Data Centers |
|
9.7. Corporate & Retail |
|
9.8. Events |
|
9.9. Others |
|
10. Regional Analysis (Market Size & Forecast: USD Million, 2022 – 2030) |
|
10.1. Regional Overview |
|
10.2. North America |
|
10.2.1. Regional Trends & Growth Drivers |
|
10.2.2. Barriers & Challenges |
|
10.2.3. Opportunities |
|
10.2.4. Factor Impact Analysis |
|
10.2.5. Technology Trends |
|
10.2.6. North America Power Rental Market, by Fuel Type |
|
10.2.7. North America Power Rental Market, by Equipment |
|
10.2.8. North America Power Rental Market, by Power Rating |
|
10.2.9. North America Power Rental Market, by Application |
|
10.2.10. North America Power Rental Market, by Rental Type |
|
10.2.11. North America Power Rental Market, by End User |
|
10.2.12. By Country |
|
10.2.12.1. US |
|
10.2.12.1.1. US Power Rental Market, by Fuel Type |
|
10.2.12.1.2. US Power Rental Market, by Equipment |
|
10.2.12.1.3. US Power Rental Market, by Power Rating |
|
10.2.12.1.4. US Power Rental Market, by Application |
|
10.2.12.1.5. US Power Rental Market, by Rental Type |
|
10.2.12.1.6. US Power Rental Market, by End User |
|
10.2.12.2. Canada |
|
10.2.12.3. Mexico |
|
*Similar segmentation will be provided for each region and country |
|
10.3. Europe |
|
10.4. Asia-Pacific |
|
10.5. Latin America |
|
10.6. Middle East & Africa |
|
11. Competitive Landscape |
|
11.1. Overview of the Key Players |
|
11.2. Competitive Ecosystem |
|
11.2.1. Level of Fragmentation |
|
11.2.2. Market Consolidation |
|
11.2.3. Product Innovation |
|
11.3. Company Share Analysis |
|
11.4. Company Benchmarking Matrix |
|
11.4.1. Strategic Overview |
|
11.4.2. Product Innovations |
|
11.5. Start-up Ecosystem |
|
11.6. Strategic Competitive Insights/ Customer Imperatives |
|
11.7. ESG Matrix/ Sustainability Matrix |
|
11.8. Manufacturing Network |
|
11.8.1. Locations |
|
11.8.2. Supply Chain and Logistics |
|
11.8.3. Product Flexibility/Customization |
|
11.8.4. Digital Transformation and Connectivity |
|
11.8.5. Environmental and Regulatory Compliance |
|
11.9. Technology Readiness Level Matrix |
|
11.10. Technology Maturity Curve |
|
11.11. Buying Criteria |
|
12. Company Profiles |
|
12.1. Aggreko |
|
12.1.1. Company Overview |
|
12.1.2. Company Financials |
|
12.1.3. Product/Service Portfolio |
|
12.1.4. Recent Developments |
|
12.1.5. IMR Analysis |
|
*Similar information will be provided for other companies |
|
12.2. Ashtead Group |
|
12.3. Atlas Copco |
|
12.4. Caterpillar |
|
12.5. Cummins |
|
12.6. Generac Power Systems |
|
12.7. Herc Rentals |
|
12.8. Shenton Group |
|
12.9. United Rentals |
|
12.10. Wacker Neuson |
|
13. Appendix |
A comprehensive market research approach was employed to gather and analyze data on the Power Rental Market. In the process, the analysis was also done to analyze the parent market and relevant adjacencies to measure the impact of them on the Power Rental Market. The research methodology encompassed both secondary and primary research techniques, ensuring the accuracy and credibility of the findings.
.jpg)
Secondary Research
Secondary research involved a thorough review of pertinent industry reports, journals, articles, and publications. Additionally, annual reports, press releases, and investor presentations of industry players were scrutinized to gain insights into their market positioning and strategies.
Primary Research
Primary research involved conducting in-depth interviews with industry experts, stakeholders, and market participants across the Power Rental ecosystem. The primary research objectives included:
- Validating findings and assumptions derived from secondary research
- Gathering qualitative and quantitative data on market trends, drivers, and challenges
- Understanding the demand-side dynamics, encompassing end-users, component manufacturers, facility providers, and service providers
- Assessing the supply-side landscape, including technological advancements and recent developments
Market Size Assessment
A combination of top-down and bottom-up approaches was utilized to analyze the overall size of the Power Rental Market. These methods were also employed to assess the size of various subsegments within the market. The market size assessment methodology encompassed the following steps:
- Identification of key industry players and relevant revenues through extensive secondary research
- Determination of the industry's supply chain and market size, in terms of value, through primary and secondary research processes
- Calculation of percentage shares, splits, and breakdowns using secondary sources and verification through primary sources
.jpg)
Data Triangulation
To ensure the accuracy and reliability of the market size, data triangulation was implemented. This involved cross-referencing data from various sources, including demand and supply side factors, market trends, and expert opinions. Additionally, top-down and bottom-up approaches were employed to validate the market size assessment.
NA