As per Intent Market Research, the Onshore Drilling Waste Management Market was valued at USD 5.4 Billion in 2024-e and will surpass USD 8.9 Billion by 2030; growing at a CAGR of 8.8% during 2025-2030.
The onshore drilling waste management market is not only expanding in line with industry growth but is also seeing a shift toward sustainable waste management practices, including recycling and reducing waste generation. Waste treatment solutions, powered by technologies like mechanical, thermal, biological, and chemical treatments, have made it possible to handle large volumes of drilling waste in a more environmentally friendly manner. This shift is driving the market across diverse industries, including oil and gas, energy, and construction. Waste management providers are investing in innovation to improve waste handling and disposal, which is crucial for reducing the environmental footprint of drilling operations.
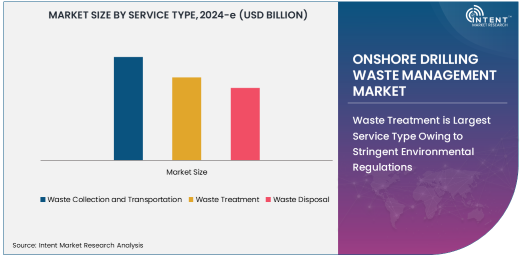
Waste Treatment is Largest Service Type Owing to Stringent Environmental Regulations
Waste treatment leads as the largest service type in the onshore drilling waste management market due to the ever-tightening environmental regulations around the disposal and management of drilling byproducts. With regulators enforcing stricter standards for waste management, oil and gas operators must turn to sophisticated waste treatment solutions that not only meet compliance standards but also reduce the environmental impact of drilling operations. Waste treatment technologies, such as thermal and chemical methods, allow companies to handle and treat drilling fluids, hydrocarbons, and other waste effectively, ensuring minimal ecological disruption.
This segment continues to dominate the market as companies aim to meet both regulatory demands and their own sustainability goals. The growing adoption of more efficient waste treatment solutions is expected to drive continued growth in this segment. The focus on sustainability, along with technological advancements in treatment methods, ensures that waste treatment will remain the leading service type in the onshore drilling waste management market for years to come.
Thermal Treatment is Fastest Growing Technology Due to Efficiency in Waste Disposal
Thermal treatment is the fastest-growing technology in the onshore drilling waste management market, thanks to its efficiency in reducing the volume and toxicity of drilling waste. Thermal methods such as incineration break down hazardous substances in drilling waste by using heat, converting them into less harmful byproducts that can be safely disposed of or recycled. This technology is particularly effective in managing complex waste types such as hydrocarbons and drilling fluids, which are difficult to treat using traditional methods.
As regulations around waste disposal become more stringent, thermal treatment has gained traction for its ability to handle large volumes of waste efficiently, especially in remote or offshore locations where traditional disposal methods may not be feasible. The cost-effective, high-volume capability of thermal treatment technologies makes it a key solution for companies looking to comply with increasing environmental standards. As demand for sustainable drilling practices grows, thermal treatment will continue to lead as the most efficient and effective technology in the market.
Drilling Cuttings is Largest Waste Type Segment Due to High Volume of Generation
Drilling cuttings are the largest waste type segment in the onshore drilling waste management market due to the significant volume of waste produced during drilling activities. As drilling operations progress, cuttings are generated from the process of breaking through rock formations. These cuttings are often mixed with drilling fluids and contain various contaminants such as hydrocarbons and heavy metals, which require proper treatment to prevent environmental contamination.
The sheer volume of drilling cuttings generated from exploration and production activities makes them the primary focus of waste management efforts. Advances in mechanical and thermal treatment technologies have enabled companies to effectively recycle or safely dispose of drilling cuttings, reducing their environmental impact. As drilling activities expand in resource-rich regions, the demand for efficient and sustainable management of drilling cuttings will continue to rise, making this the largest waste type segment in the market.
Oil and Gas Exploration and Production is Largest End-User Industry Due to Continuous Drilling Activities
The largest end-user industry for onshore drilling waste management services is oil and gas exploration and production (E&P), driven by the continuous drilling activities inherent in the industry. Exploration and extraction of oil and gas deposits generate substantial amounts of waste, including cuttings, fluids, and sludge, which need to be managed to minimize their environmental impact. As the global demand for energy rises, the volume of drilling activities—and consequently, drilling waste—is expected to grow, further increasing the need for waste management services.
E&P companies face increasing pressure to implement sustainable practices in waste disposal and treatment. With stricter regulations and growing environmental awareness, these companies are turning to advanced waste management technologies to improve the efficiency and sustainability of their operations. This demand for more effective and eco-friendly waste management solutions has solidified the oil and gas industry as the largest consumer of these services, with a growing emphasis on waste recycling and reduction.
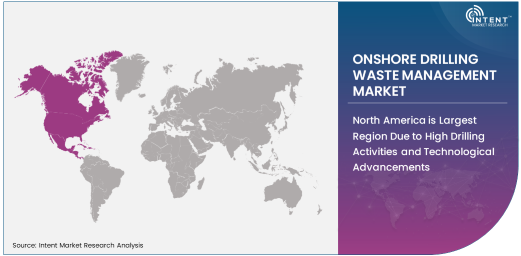
North America is Largest Region Due to High Drilling Activities and Technological Advancements
North America holds the largest share of the onshore drilling waste management market, driven by high levels of drilling activity in the United States and Canada, particularly in shale formations. The region’s rich oil and gas reserves have led to a surge in exploration and production efforts, which in turn has increased the volume of drilling waste generated. This high demand for drilling waste management services is further supported by North America's commitment to environmental sustainability and regulatory compliance, driving the adoption of advanced waste treatment technologies.
The presence of major oil and gas players in North America, along with technological advancements in waste management methods, continues to propel the region’s dominance in the market. The region's extensive experience in managing drilling waste, combined with its focus on minimizing the environmental impact of oil and gas operations, ensures that North America will remain the leading market for drilling waste management solutions in the foreseeable future.
Leading Companies and Competitive Landscape
The onshore drilling waste management market is highly competitive, with several major players leading the charge in providing waste management services. Key companies such as Halliburton, Schlumberger, Veolia North America, and National Oilwell Varco offer a broad range of services including waste collection, transportation, treatment, and disposal, utilizing innovative technologies like mechanical, thermal, biological, and chemical treatments. These companies are well-positioned in the market due to their extensive industry experience and comprehensive service offerings.
Competition in the market is primarily driven by technology innovation, regulatory compliance, and the ability to deliver environmentally sustainable solutions. As environmental concerns continue to grow, companies are focusing on developing new and more efficient waste treatment methods, such as enhanced recycling technologies and waste-to-energy solutions. Additionally, strategic partnerships, mergers, and acquisitions are becoming increasingly common as companies seek to expand their service capabilities and strengthen their market positions. With the continuous evolution of drilling waste management technology, competition in the market is expected to intensify, as players strive to meet the needs of a more sustainable oil and gas industry.
Recent Developments:
- In December 2024, Veolia North America launched a new drilling waste treatment service tailored for onshore operations in North America.
- In November 2024, Halliburton expanded its waste management capabilities by incorporating advanced thermal treatment solutions for onshore drilling operations.
- In October 2024, Baker Hughes announced a collaboration with a major oil producer to improve onshore waste disposal efficiency using biological treatment methods.
- In September 2024, Schlumberger rolled out a cutting-edge waste management technology that minimizes environmental impact in remote onshore drilling sites.
- In August 2024, Clean Harbors signed a contract with an offshore drilling company to manage waste disposal operations for its onshore drilling sites.
List of Leading Companies:
- Veolia North America
- Halliburton Company
- Schlumberger Limited
- National Oilwell Varco, Inc.
- Waste Management, Inc.
- Baker Hughes Incorporated
- EnviroServe
- Clean Harbors, Inc.
- SUEZ Group
- Expro Group
- Diamond Offshore Drilling, Inc.
- Aker Solutions
- KBR, Inc.
- Weatherford International plc
- Odfjell Drilling Ltd.
Report Scope:
|
Report Features |
Description |
|
Market Size (2024-e) |
USD 5.4 Billion |
|
Forecasted Value (2030) |
USD 8.9 Billion |
|
CAGR (2025 – 2030) |
8.8% |
|
Base Year for Estimation |
2024-e |
|
Historic Year |
2023 |
|
Forecast Period |
2025 – 2030 |
|
Report Coverage |
Market Forecast, Market Dynamics, Competitive Landscape, Recent Developments |
|
Segments Covered |
Onshore Drilling Waste Management Market by Service Type (Waste Collection and Transportation, Waste Treatment, Waste Disposal), Technology (Mechanical Treatment, Thermal Treatment, Biological Treatment, Chemical Treatment), Waste Type (Drilling Cuttings, Produced Water, Drilling Fluids, Sludge, Hydrocarbons), End-User Industry (Oil and Gas Exploration and Production, Energy (Renewable Energy, Utilities), Marine Industry, Construction and Civil Engineering) |
|
Regional Analysis |
North America (US, Canada, Mexico), Europe (Germany, France, UK, Italy, Spain, and Rest of Europe), Asia-Pacific (China, Japan, South Korea, Australia, India, and Rest of Asia-Pacific), Latin America (Brazil, Argentina, and Rest of Latin America), Middle East & Africa (Saudi Arabia, UAE, Rest of Middle East & Africa) |
|
Major Companies |
Veolia North America, Halliburton Company, Schlumberger Limited, National Oilwell Varco, Inc., Waste Management, Inc., Baker Hughes Incorporated, EnviroServe, Clean Harbors, Inc., SUEZ Group, Expro Group, Diamond Offshore Drilling, Inc., Aker Solutions, KBR, Inc., Weatherford International plc, Odfjell Drilling Ltd. |
|
Customization Scope |
Customization for segments, region/country-level will be provided. Moreover, additional customization can be done based on the requirements |
|
1. Introduction |
|
1.1. Market Definition |
|
1.2. Scope of the Study |
|
1.3. Research Assumptions |
|
1.4. Study Limitations |
|
2. Research Methodology |
|
2.1. Research Approach |
|
2.1.1. Top-Down Method |
|
2.1.2. Bottom-Up Method |
|
2.1.3. Factor Impact Analysis |
|
2.2. Insights & Data Collection Process |
|
2.2.1. Secondary Research |
|
2.2.2. Primary Research |
|
2.3. Data Mining Process |
|
2.3.1. Data Analysis |
|
2.3.2. Data Validation and Revalidation |
|
2.3.3. Data Triangulation |
|
3. Executive Summary |
|
3.1. Major Markets & Segments |
|
3.2. Highest Growing Regions and Respective Countries |
|
3.3. Impact of Growth Drivers & Inhibitors |
|
3.4. Regulatory Overview by Country |
|
4. Onshore Drilling Waste Management Market, by Service Type (Market Size & Forecast: USD Million, 2023 – 2030) |
|
4.1. Waste Collection and Transportation |
|
4.2. Waste Treatment |
|
4.3. Waste Disposal |
|
5. Onshore Drilling Waste Management Market, by Technology (Market Size & Forecast: USD Million, 2023 – 2030) |
|
5.1. Mechanical Treatment |
|
5.2. Thermal Treatment |
|
5.3. Biological Treatment |
|
5.4. Chemical Treatment |
|
6. Onshore Drilling Waste Management Market, by Waste Type (Market Size & Forecast: USD Million, 2023 – 2030) |
|
6.1. Drilling Cuttings |
|
6.2. Produced Water |
|
6.3. Drilling Fluids |
|
6.4. Sludge |
|
6.5. Hydrocarbons |
|
7. Onshore Drilling Waste Management Market, by End-User Industry (Market Size & Forecast: USD Million, 2023 – 2030) |
|
7.1. Oil and Gas Exploration and Production |
|
7.2. Energy (Renewable Energy, Utilities) |
|
7.3. Marine Industry |
|
7.4. Construction and Civil Engineering |
|
8. Regional Analysis (Market Size & Forecast: USD Million, 2023 – 2030) |
|
8.1. Regional Overview |
|
8.2. North America |
|
8.2.1. Regional Trends & Growth Drivers |
|
8.2.2. Barriers & Challenges |
|
8.2.3. Opportunities |
|
8.2.4. Factor Impact Analysis |
|
8.2.5. Technology Trends |
|
8.2.6. North America Onshore Drilling Waste Management Market, by Service Type |
|
8.2.7. North America Onshore Drilling Waste Management Market, by Technology |
|
8.2.8. North America Onshore Drilling Waste Management Market, by Waste Type |
|
8.2.9. North America Onshore Drilling Waste Management Market, by End-User Industry |
|
8.2.10. By Country |
|
8.2.10.1. US |
|
8.2.10.1.1. US Onshore Drilling Waste Management Market, by Service Type |
|
8.2.10.1.2. US Onshore Drilling Waste Management Market, by Technology |
|
8.2.10.1.3. US Onshore Drilling Waste Management Market, by Waste Type |
|
8.2.10.1.4. US Onshore Drilling Waste Management Market, by End-User Industry |
|
8.2.10.2. Canada |
|
8.2.10.3. Mexico |
|
*Similar segmentation will be provided for each region and country |
|
8.3. Europe |
|
8.4. Asia-Pacific |
|
8.5. Latin America |
|
8.6. Middle East & Africa |
|
9. Competitive Landscape |
|
9.1. Overview of the Key Players |
|
9.2. Competitive Ecosystem |
|
9.2.1. Level of Fragmentation |
|
9.2.2. Market Consolidation |
|
9.2.3. Product Innovation |
|
9.3. Company Share Analysis |
|
9.4. Company Benchmarking Matrix |
|
9.4.1. Strategic Overview |
|
9.4.2. Product Innovations |
|
9.5. Start-up Ecosystem |
|
9.6. Strategic Competitive Insights/ Customer Imperatives |
|
9.7. ESG Matrix/ Sustainability Matrix |
|
9.8. Manufacturing Network |
|
9.8.1. Locations |
|
9.8.2. Supply Chain and Logistics |
|
9.8.3. Product Flexibility/Customization |
|
9.8.4. Digital Transformation and Connectivity |
|
9.8.5. Environmental and Regulatory Compliance |
|
9.9. Technology Readiness Level Matrix |
|
9.10. Technology Maturity Curve |
|
9.11. Buying Criteria |
|
10. Company Profiles |
|
10.1. Veolia North America |
|
10.1.1. Company Overview |
|
10.1.2. Company Financials |
|
10.1.3. Product/Service Portfolio |
|
10.1.4. Recent Developments |
|
10.1.5. IMR Analysis |
|
*Similar information will be provided for other companies |
|
10.2. Halliburton Company |
|
10.3. Schlumberger Limited |
|
10.4. National Oilwell Varco, Inc. |
|
10.5. Waste Management, Inc. |
|
10.6. Baker Hughes Incorporated |
|
10.7. EnviroServe |
|
10.8. Clean Harbors, Inc. |
|
10.9. SUEZ Group |
|
10.10. Expro Group |
|
10.11. Diamond Offshore Drilling, Inc. |
|
10.12. Aker Solutions |
|
10.13. KBR, Inc. |
|
10.14. Weatherford International plc |
|
10.15. Odfjell Drilling Ltd. |
|
11. Appendix |
A comprehensive market research approach was employed to gather and analyze data on the Onshore Drilling Waste Management Market. In the process, the analysis was also done to analyze the parent market and relevant adjacencies to measure the impact of them on the Onshore Drilling Waste Management Market. The research methodology encompassed both secondary and primary research techniques, ensuring the accuracy and credibility of the findings.
.jpg)
Secondary Research
Secondary research involved a thorough review of pertinent industry reports, journals, articles, and publications. Additionally, annual reports, press releases, and investor presentations of industry players were scrutinized to gain insights into their market positioning and strategies.
Primary Research
Primary research involved conducting in-depth interviews with industry experts, stakeholders, and market participants across the E-Waste Management ecosystem. The primary research objectives included:
- Validating findings and assumptions derived from secondary research
- Gathering qualitative and quantitative data on market trends, drivers, and challenges
- Understanding the demand-side dynamics, encompassing end-users, component manufacturers, facility providers, and service providers
- Assessing the supply-side landscape, including technological advancements and recent developments
Market Size Assessment
A combination of top-down and bottom-up approaches was utilized to analyze the overall size of the Onshore Drilling Waste Management Market. These methods were also employed to assess the size of various subsegments within the market. The market size assessment methodology encompassed the following steps:
- Identification of key industry players and relevant revenues through extensive secondary research
- Determination of the industry's supply chain and market size, in terms of value, through primary and secondary research processes
- Calculation of percentage shares, splits, and breakdowns using secondary sources and verification through primary sources
.jpg)
Data Triangulation
To ensure the accuracy and reliability of the market size, data triangulation was implemented. This involved cross-referencing data from various sources, including demand and supply side factors, market trends, and expert opinions. Additionally, top-down and bottom-up approaches were employed to validate the market size assessment.
NA