As per Intent Market Research, the Multiple Myeloma Therapeutics Market was valued at USD 22.2 Billion in 2024-e and will surpass USD 39.7 Billion by 2030; growing at a CAGR of 8.7% during 2025-2030.
The global multiple myeloma therapeutics market is witnessing substantial growth, driven by the increasing incidence of multiple myeloma, advancements in treatment options, and the growing focus on personalized medicine. Multiple myeloma, a type of blood cancer affecting plasma cells in the bone marrow, has historically been challenging to treat, but recent breakthroughs in drug development have significantly improved survival rates. The market is segmented into therapeutic types, drug classes, routes of administration, end-users, and distribution channels, each playing a pivotal role in the overall growth and dynamics of the market. With the rise of innovative therapies such as immunotherapy, targeted therapy, and stem cell transplantation, the therapeutic landscape for multiple myeloma continues to evolve, offering hope for patients and driving industry growth. This growth is supported by major pharmaceutical companies' investments in research and development, along with collaborations and partnerships aimed at bringing new treatments to market.
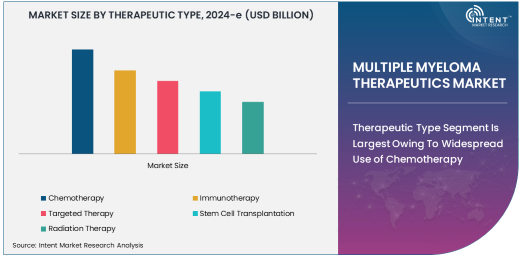
Therapeutic Type Segment Is Largest Owing To Widespread Use of Chemotherapy
The therapeutic approaches for multiple myeloma are diverse, with chemotherapy remaining the largest segment owing to its extensive use in treating various stages of the disease. Chemotherapy has been a cornerstone in managing multiple myeloma for decades and is often employed in combination with other therapies for better outcomes. Its broad application and established clinical efficacy in controlling the disease, particularly in advanced stages, keep chemotherapy at the forefront of treatment strategies. The success of chemotherapy regimens in improving survival rates and controlling symptoms has led to its widespread adoption across global healthcare systems.
While newer therapies like immunotherapy and targeted therapy are gaining traction, chemotherapy remains essential in many treatment protocols, particularly for newly diagnosed patients or those in need of quick remission. As a result, chemotherapy-based treatments continue to dominate the market, and ongoing clinical trials aim to improve its effectiveness and reduce side effects, ensuring its continued relevance in the therapeutic landscape.
Drug Class Segment Is Dominated By Proteasome Inhibitors Due To Proven Efficacy
Proteasome inhibitors are the dominant drug class in the multiple myeloma therapeutics market. These drugs work by inhibiting the proteasome, a complex responsible for breaking down unneeded or damaged proteins in cells. This action causes an accumulation of defective proteins, leading to cancer cell death. Proteasome inhibitors, particularly bortezomib and carfilzomib, have shown exceptional clinical outcomes in treating multiple myeloma, especially in relapsed or refractory cases. They are often used in combination with other drug classes, enhancing their effectiveness and increasing the chances of achieving remission.
Due to their proven ability to target the molecular mechanisms underlying multiple myeloma, proteasome inhibitors have become a cornerstone in treatment regimens, contributing significantly to the market’s growth. With continued research into improving the pharmacokinetics and reducing side effects of these inhibitors, this drug class is expected to retain its dominant position in the market for the foreseeable future.
Route of Administration Segment Is Fastest Growing With Oral Medications
The oral route of administration is the fastest-growing segment in the multiple myeloma therapeutics market. Oral medications offer several advantages, including ease of use, patient convenience, and better adherence to treatment regimens. Drugs like lenalidomide and pomalidomide, which are commonly prescribed for multiple myeloma, have gained popularity due to their oral administration, allowing patients to take their medications at home instead of visiting healthcare facilities for intravenous treatments.
This shift towards oral therapies is also driven by a growing preference for non-invasive treatments, especially for patients managing chronic conditions. Oral medications not only improve patient quality of life but also reduce healthcare costs associated with hospital visits and injections, further boosting the demand for oral therapeutics. As the number of oral therapies for multiple myeloma continues to grow, this segment is set to expand rapidly in the coming years.
End-User Segment Is Largest Owing To Dominance of Hospitals in Treatment Delivery
Hospitals are the largest end-users in the multiple myeloma therapeutics market, primarily due to their ability to offer comprehensive care, including diagnosis, treatment, and ongoing monitoring of patients with advanced or complex forms of multiple myeloma. Hospitals provide a range of services, from chemotherapy administration to stem cell transplants, and are equipped with the necessary infrastructure to manage severe cases.
Most patients, especially those requiring intensive therapies such as stem cell transplantation or combination regimens, are treated in hospital settings, further solidifying the dominance of hospitals in the end-user segment. As treatment regimens become more complex and personalized, hospitals will continue to play a critical role in delivering advanced multiple myeloma therapeutics, ensuring they remain the largest end-user group.
Distribution Channel Segment Is Dominated By Retail Pharmacies
Retail pharmacies are the most widely used distribution channel for multiple myeloma therapeutics, especially for drugs that can be administered orally. Retail pharmacies offer patients easy access to medications and provide counseling services to ensure proper medication management. The growing trend towards oral therapies has further strengthened the role of retail pharmacies in the distribution of multiple myeloma drugs, allowing patients to fill prescriptions conveniently.
In addition, the expansion of online pharmacies has also supported the growth of retail channels, providing an additional outlet for patients to access medications. Retail pharmacies offer competitive pricing, customer convenience, and a broad range of treatment options, making them the most important distribution channel in the multiple myeloma therapeutics market.
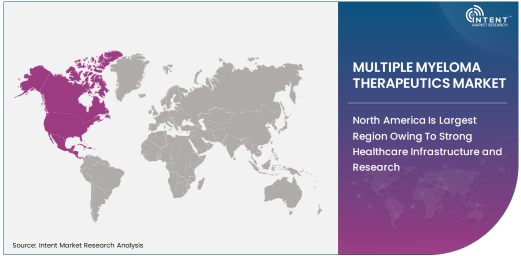
North America Is Largest Region Owing To Strong Healthcare Infrastructure and Research
North America remains the largest region in the multiple myeloma therapeutics market, driven by its advanced healthcare infrastructure, high treatment adoption rates, and ongoing investment in research and development. The United States, in particular, is a leader in the development and approval of new multiple myeloma therapies, with a high number of clinical trials and FDA-approved treatments. Additionally, the prevalence of multiple myeloma in North America, coupled with the presence of well-established healthcare systems and insurance structures, has contributed to the market's growth in this region.
The increasing number of FDA-approved therapies and the presence of leading pharmaceutical companies in the region further solidify North America’s dominant position. As research continues and new therapies emerge, the North American market is expected to remain a key player in the global multiple myeloma therapeutics landscape.
Leading Companies and Competitive Landscape
The multiple myeloma therapeutics market is characterized by the dominance of key players such as Johnson & Johnson, Bristol-Myers Squibb, Amgen, Novartis, and Merck. These companies lead the market with their broad portfolios of chemotherapy, immunotherapy, and targeted therapy options for multiple myeloma. These major players are focused on expanding their product offerings through new drug approvals, strategic partnerships, and ongoing research into more effective and personalized treatment options.
Smaller biotechnology firms are also playing a vital role in driving innovation, especially in the development of novel therapies such as CAR-T cell therapies and bispecific antibodies. As competition intensifies, these companies will continue to focus on differentiation through product innovation, patient-centric treatments, and strategic acquisitions to enhance their market presence and capabilities in the fight against multiple myeloma. The competitive landscape is expected to remain dynamic, with continued emphasis on collaborative efforts, drug pipeline expansion, and technological advancements in personalized medicine.
Recent Developments:
- Johnson & Johnson announced a new FDA approval for its innovative therapy aimed at treating relapsed/refractory multiple myeloma, marking a significant milestone for the company in hematology.
- Bristol-Myers Squibb received approval for its new immunotherapy, Opdivo, for treating multiple myeloma, expanding its oncology pipeline with a focus on improving patient outcomes.
- Amgen Inc. launched a new combination therapy that includes its flagship drug, Kyprolis, to treat advanced multiple myeloma, showing increased efficacy over traditional treatments.
- Novartis International AG secured regulatory clearance for a CAR T-cell therapy for multiple myeloma, representing a new frontier in immunotherapy for blood cancers.
- Merck & Co. entered into a strategic partnership with an emerging biotech firm to co-develop next-generation monoclonal antibodies, focused on improving long-term outcomes for myeloma patients.
List of Leading Companies:
- Johnson & Johnson
- Celgene Corporation (Bristol-Myers Squibb)
- Amgen Inc.
- Novartis International AG
- Takeda Pharmaceutical Company
- Merck & Co., Inc.
- Sanofi S.A.
- AbbVie Inc.
- Gilead Sciences, Inc.
- Roche Holding AG
- GlaxoSmithKline plc
- AstraZeneca
- Regeneron Pharmaceuticals
- Eli Lilly and Co.
- Teva Pharmaceutical Industries Ltd
Report Scope:
|
Report Features |
Description |
|
Market Size (2024-e) |
USD 22.2 Billion |
|
Forecasted Value (2030) |
USD 39.7 Billion |
|
CAGR (2025 – 2030) |
8.7% |
|
Base Year for Estimation |
2024-e |
|
Historic Year |
2023 |
|
Forecast Period |
2025 – 2030 |
|
Report Coverage |
Market Forecast, Market Dynamics, Competitive Landscape, Recent Developments |
|
Segments Covered |
Multiple Myeloma Therapeutics Market By Therapeutic Type (Chemotherapy, Immunotherapy, Targeted Therapy, Stem Cell Transplantation, Radiation Therapy), By Drug Class (Proteasome Inhibitors, Immunomodulatory Drugs, Monoclonal Antibodies, Histone Deacetylase Inhibitors, Bispecific Antibodies), By Route of Administration (Oral, Injectable, Intravenous), By End-User (Hospitals, Specialty Clinics, Homecare), and By Distribution Channel (Retail Pharmacies, Online Pharmacies, Hospital Pharmacies) |
|
Regional Analysis |
North America (US, Canada, Mexico), Europe (Germany, France, UK, Italy, Spain, and Rest of Europe), Asia-Pacific (China, Japan, South Korea, Australia, India, and Rest of Asia-Pacific), Latin America (Brazil, Argentina, and Rest of Latin America), Middle East & Africa (Saudi Arabia, UAE, Rest of Middle East & Africa) |
|
Major Companies |
Johnson & Johnson, Celgene Corporation (Bristol-Myers Squibb), Amgen Inc., Novartis International AG, Takeda Pharmaceutical Company, Merck & Co., Inc., Sanofi S.A., AbbVie Inc., Gilead Sciences, Inc., Roche Holding AG, GlaxoSmithKline plc, AstraZeneca, Regeneron Pharmaceuticals, Eli Lilly and Co., Teva Pharmaceutical Industries Ltd |
|
Customization Scope |
Customization for segments, region/country-level will be provided. Moreover, additional customization can be done based on the requirements |
|
1. Introduction |
|
1.1. Market Definition |
|
1.2. Scope of the Study |
|
1.3. Research Assumptions |
|
1.4. Study Limitations |
|
2. Research Methodology |
|
2.1. Research Approach |
|
2.1.1. Top-Down Method |
|
2.1.2. Bottom-Up Method |
|
2.1.3. Factor Impact Analysis |
|
2.2. Insights & Data Collection Process |
|
2.2.1. Secondary Research |
|
2.2.2. Primary Research |
|
2.3. Data Mining Process |
|
2.3.1. Data Analysis |
|
2.3.2. Data Validation and Revalidation |
|
2.3.3. Data Triangulation |
|
3. Executive Summary |
|
3.1. Major Markets & Segments |
|
3.2. Highest Growing Regions and Respective Countries |
|
3.3. Impact of Growth Drivers & Inhibitors |
|
3.4. Regulatory Overview by Country |
|
4. Multiple Input Multiple Output (MIMO) Market, by Product Type (Market Size & Forecast: USD Million, 2023 – 2030) |
|
4.1. Massive MIMO |
|
4.2. Small-Scale MIMO |
|
4.3. Large-Scale MIMO |
|
5. Multiple Input Multiple Output (MIMO) Market, by Technology (Market Size & Forecast: USD Million, 2023 – 2030) |
|
5.1. 4G MIMO |
|
5.2. 5G MIMO |
|
5.3. Wi-Fi MIMO |
|
5.4. LTE MIMO |
|
5.5. Others |
|
6. Multiple Input Multiple Output (MIMO) Market, by Component (Market Size & Forecast: USD Million, 2023 – 2030) |
|
6.1. Transmitters |
|
6.2. Receivers |
|
6.3. Antennas |
|
6.4. Controllers |
|
6.5. Amplifiers |
|
7. Multiple Input Multiple Output (MIMO) Market, by End-User Industry (Market Size & Forecast: USD Million, 2023 – 2030) |
|
7.1. Telecommunications |
|
7.2. Automotive |
|
7.3. Healthcare |
|
7.4. Consumer Electronics |
|
7.5. Aerospace & Defense |
|
7.6. Manufacturing |
|
8. Multiple Input Multiple Output (MIMO) Market, by Application (Market Size & Forecast: USD Million, 2023 – 2030) |
|
8.1. Wireless Communication |
|
8.2. Internet of Things (IoT) |
|
8.3. Data Centers |
|
8.4. Smart Cities |
|
8.5. Smart Homes |
|
9. Regional Analysis (Market Size & Forecast: USD Million, 2023 – 2030) |
|
9.1. Regional Overview |
|
9.2. North America |
|
9.2.1. Regional Trends & Growth Drivers |
|
9.2.2. Barriers & Challenges |
|
9.2.3. Opportunities |
|
9.2.4. Factor Impact Analysis |
|
9.2.5. Technology Trends |
|
9.2.6. North America Multiple Input Multiple Output (MIMO) Market, by Product Type |
|
9.2.7. North America Multiple Input Multiple Output (MIMO) Market, by Technology |
|
9.2.8. North America Multiple Input Multiple Output (MIMO) Market, by Component |
|
9.2.9. North America Multiple Input Multiple Output (MIMO) Market, by End-User Industry |
|
9.2.10. North America Multiple Input Multiple Output (MIMO) Market, by Application |
|
9.2.11. By Country |
|
9.2.11.1. US |
|
9.2.11.1.1. US Multiple Input Multiple Output (MIMO) Market, by Product Type |
|
9.2.11.1.2. US Multiple Input Multiple Output (MIMO) Market, by Technology |
|
9.2.11.1.3. US Multiple Input Multiple Output (MIMO) Market, by Component |
|
9.2.11.1.4. US Multiple Input Multiple Output (MIMO) Market, by End-User Industry |
|
9.2.11.1.5. US Multiple Input Multiple Output (MIMO) Market, by Application |
|
9.2.11.2. Canada |
|
9.2.11.3. Mexico |
|
*Similar segmentation will be provided for each region and country |
|
9.3. Europe |
|
9.4. Asia-Pacific |
|
9.5. Latin America |
|
9.6. Middle East & Africa |
|
10. Competitive Landscape |
|
10.1. Overview of the Key Players |
|
10.2. Competitive Ecosystem |
|
10.2.1. Level of Fragmentation |
|
10.2.2. Market Consolidation |
|
10.2.3. Product Innovation |
|
10.3. Company Share Analysis |
|
10.4. Company Benchmarking Matrix |
|
10.4.1. Strategic Overview |
|
10.4.2. Product Innovations |
|
10.5. Start-up Ecosystem |
|
10.6. Strategic Competitive Insights/ Customer Imperatives |
|
10.7. ESG Matrix/ Sustainability Matrix |
|
10.8. Manufacturing Network |
|
10.8.1. Locations |
|
10.8.2. Supply Chain and Logistics |
|
10.8.3. Product Flexibility/Customization |
|
10.8.4. Digital Transformation and Connectivity |
|
10.8.5. Environmental and Regulatory Compliance |
|
10.9. Technology Readiness Level Matrix |
|
10.10. Technology Maturity Curve |
|
10.11. Buying Criteria |
|
11. Company Profiles |
|
11.1. Huawei Technologies Co. Ltd. |
|
11.1.1. Company Overview |
|
11.1.2. Company Financials |
|
11.1.3. Product/Service Portfolio |
|
11.1.4. Recent Developments |
|
11.1.5. IMR Analysis |
|
*Similar information will be provided for other companies |
|
11.2. Qualcomm Inc. |
|
11.3. Ericsson AB |
|
11.4. Nokia Corporation |
|
11.5. ZTE Corporation |
|
11.6. Samsung Electronics Co. Ltd. |
|
11.7. Intel Corporation |
|
11.8. Texas Instruments Inc. |
|
11.9. Broadcom Inc. |
|
11.10. Cisco Systems, Inc. |
|
11.11. MediaTek Inc. |
|
11.12. Raytheon Technologies Corporation |
|
11.13. Marvell Technology, Inc. |
|
11.14. Mitsubishi Electric Corporation |
|
11.15. Thales Group |
|
12. Appendix |
A comprehensive market research approach was employed to gather and analyze data on the Multiple Myeloma Therapeutics Market. In the process, the analysis was also done to analyze the parent market and relevant adjacencies to measure the impact of them on the Multiple Myeloma Therapeutics Market. The research methodology encompassed both secondary and primary research techniques, ensuring the accuracy and credibility of the findings.
.jpg)
Secondary Research
Secondary research involved a thorough review of pertinent industry reports, journals, articles, and publications. Additionally, annual reports, press releases, and investor presentations of industry players were scrutinized to gain insights into their market positioning and strategies.
Primary Research
Primary research involved conducting in-depth interviews with industry experts, stakeholders, and market participants across the E-Waste Management ecosystem. The primary research objectives included:
- Validating findings and assumptions derived from secondary research
- Gathering qualitative and quantitative data on market trends, drivers, and challenges
- Understanding the demand-side dynamics, encompassing end-users, component manufacturers, facility providers, and service providers
- Assessing the supply-side landscape, including technological advancements and recent developments
Market Size Assessment
A combination of top-down and bottom-up approaches was utilized to analyze the overall size of the Multiple Myeloma Therapeutics Market. These methods were also employed to assess the size of various subsegments within the market. The market size assessment methodology encompassed the following steps:
- Identification of key industry players and relevant revenues through extensive secondary research
- Determination of the industry's supply chain and market size, in terms of value, through primary and secondary research processes
- Calculation of percentage shares, splits, and breakdowns using secondary sources and verification through primary sources
.jpg)
Data Triangulation
To ensure the accuracy and reliability of the market size, data triangulation was implemented. This involved cross-referencing data from various sources, including demand and supply side factors, market trends, and expert opinions. Additionally, top-down and bottom-up approaches were employed to validate the market size assessment.
NA