As per Intent Market Research, the Micro Mobility Charging Infrastructure Market was valued at USD 0.8 billion in 2024-e and will surpass USD 2.1 billion by 2030; growing at a CAGR of 16.9% during 2025 - 2030.
The micro mobility charging infrastructure market is experiencing rapid growth due to the increasing adoption of electric scooters, bicycles, and other micro-mobility vehicles. These electric vehicles (EVs) are becoming an essential part of urban transportation systems, offering eco-friendly alternatives to traditional vehicles while addressing issues like traffic congestion and environmental pollution. As more cities promote sustainable mobility solutions, the demand for efficient and accessible charging infrastructure to support these electric vehicles has surged. This growth is further fueled by advancements in charging technologies, such as DC fast charging and wireless charging, making it easier for users to recharge their vehicles conveniently and quickly.
With governments and private entities investing in the development of EV infrastructure, the market is expanding in both urban and suburban areas. Public, private, and commercial charging stations are being deployed to cater to the needs of micro-mobility vehicle owners, ensuring widespread availability and reducing charging time. The continued growth of the market is expected to be driven by technological innovations in charging methods and an increased focus on expanding the coverage of charging stations, making micro-mobility solutions more accessible and practical for everyday use.
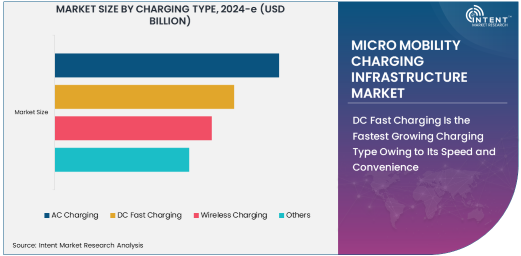
DC Fast Charging Is the Fastest Growing Charging Type Owing to Its Speed and Convenience
DC fast charging is the fastest growing charging type within the micro mobility charging infrastructure market, driven by its speed and convenience. Unlike traditional AC chargers, DC fast chargers can significantly reduce the time needed to recharge micro-mobility vehicles, offering a faster and more efficient solution for users in need of quick turnaround times. As the demand for micro-mobility solutions continues to grow, particularly in densely populated urban areas, the need for fast charging infrastructure becomes even more crucial.
DC fast charging technology is becoming increasingly popular due to its ability to provide a high power output, allowing vehicles to be charged to 80% or more in under an hour. This is a game changer for users who rely on electric scooters, bikes, and mopeds for daily commuting or delivery services, as it minimizes downtime and boosts the practicality of using electric micro-mobility vehicles. As governments and private players invest heavily in expanding fast-charging networks, the demand for DC fast charging stations is expected to grow exponentially, making it the fastest-growing segment within the market.
Public Charging Stations Are the Largest Segment Owing to High Demand for Accessibility
Public charging stations represent the largest segment in the micro mobility charging infrastructure market, owing to the high demand for accessible charging solutions in urban environments. As micro-mobility vehicles become a preferred mode of transportation in cities worldwide, the need for widespread and easily accessible charging stations is essential. Public charging stations are typically located in high-traffic areas such as city centers, transportation hubs, and residential complexes, ensuring that users can easily find charging points during their daily commutes.
The growth of public charging stations is also supported by government initiatives that promote the adoption of electric vehicles and micro-mobility solutions. Cities are investing in the development of public charging infrastructure to reduce range anxiety and increase the adoption of electric scooters and bicycles. With increasing urbanization and the rising popularity of sustainable transportation options, the demand for public charging stations will continue to drive the largest portion of the micro-mobility charging infrastructure market.
Electric Scooters Lead End-Use Industry Demand Owing to Rapid Adoption in Urban Areas
Electric scooters are the leading end-use industry within the micro mobility charging infrastructure market, driven by their rapid adoption in urban areas. As cities worldwide look for sustainable alternatives to traditional vehicles, electric scooters have emerged as an ideal solution for short-distance travel. Their affordability, ease of use, and environmental benefits have made them particularly popular for last-mile transportation. The rising trend of shared micro-mobility services, which provide electric scooters for short-term rentals, has also contributed to the increasing demand for charging infrastructure.
Electric scooters require efficient charging solutions to maintain their accessibility and usability. As a result, charging infrastructure providers are focusing on establishing a comprehensive network of charging stations specifically designed for electric scooters. This growth is further supported by advancements in battery technology and charging systems that reduce charging time, making electric scooters a more viable option for daily use. As the adoption of electric scooters continues to expand, the need for dedicated charging stations will increase, solidifying their position as the largest end-use industry within the market.
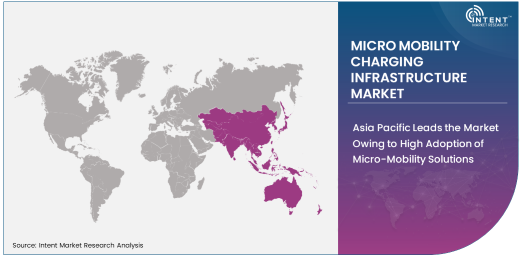
Asia Pacific Leads the Market Owing to High Adoption of Micro-Mobility Solutions
Asia Pacific is the leading region in the micro mobility charging infrastructure market, driven by the high adoption of micro-mobility solutions in countries like China, India, and Japan. These countries are witnessing rapid urbanization, leading to an increased demand for sustainable and efficient transportation options. Electric scooters, bicycles, and mopeds are becoming popular in dense urban environments, where traditional vehicles often struggle with congestion and limited parking.
Governments in the region are also promoting the adoption of micro-mobility solutions through incentives, regulations, and investments in infrastructure. In addition, the growing presence of micro-mobility sharing services in major cities has created a need for a reliable and widespread charging network. As a result, Asia Pacific is expected to continue to dominate the market for micro mobility charging infrastructure, driven by both government policies and the increasing consumer demand for eco-friendly transportation options.
Leading Companies and Competitive Landscape
The micro mobility charging infrastructure market is highly competitive, with several players offering innovative solutions to cater to the growing demand for electric vehicle charging. Key companies in the market include ChargePoint, ABB, Schneider Electric, and Siemens, which are actively developing and deploying charging stations for micro-mobility vehicles. These companies are focusing on enhancing the efficiency and scalability of charging infrastructure, with a strong emphasis on faster charging technologies such as DC fast charging.
The competitive landscape is also characterized by a rise in partnerships between micro-mobility service providers and charging infrastructure companies, aiming to build a seamless network of charging stations across urban areas. Startups and emerging players are also entering the market, leveraging new technologies like wireless charging and advanced battery management systems to provide innovative charging solutions. As the demand for micro-mobility vehicles and associated charging infrastructure grows, the competition among these players will intensify, driving further innovation and expansion in the market.
Recent Developments:
- In November 2024, ChargePoint expanded its micro mobility charging network to include electric scooters.
- In October 2024, EVBox announced the launch of a new DC fast charging station specifically for electric bikes.
- In September 2024, Siemens AG partnered with Greenlots to provide smarter charging solutions for e-scooters.
- In August 2024, Blink Charging Co. introduced wireless charging stations for electric mopeds in major cities.
- In July 2024, Tesla launched a new line of ultra-fast chargers for micro mobility vehicles.
List of Leading Companies:
- Siemens AG
- ABB Group
- Schneider Electric
- ChargePoint, Inc.
- EVBox
- Wallbox Chargers
- Blink Charging Co.
- Tesla, Inc.
- AeroVironment, Inc.
- Enel X
- Greenlots
- BYD Company
- Bosch Automotive
- Volta Charging
- Engie SA
Report Scope:
|
Report Features |
Description |
|
Market Size (2024-e) |
USD 0.8 billion |
|
Forecasted Value (2030) |
USD 2.1 billion |
|
CAGR (2025 – 2030) |
16.9% |
|
Base Year for Estimation |
2024-e |
|
Historic Year |
2023 |
|
Forecast Period |
2025 – 2030 |
|
Report Coverage |
Market Forecast, Market Dynamics, Competitive Landscape, Recent Developments |
|
Segments Covered |
Micro Mobility Charging Infrastructure Market By Charging Type (AC Charging, DC Fast Charging, Wireless Charging), By Charging Station Type (Public Charging Stations, Private Charging Stations, Commercial Charging Stations), By End-Use Industry (Electric Scooters, Electric Bicycles, Electric Mopeds) |
|
Regional Analysis |
North America (US, Canada, Mexico), Europe (Germany, France, UK, Italy, Spain, and Rest of Europe), Asia-Pacific (China, Japan, South Korea, Australia, India, and Rest of Asia-Pacific), Latin America (Brazil, Argentina, and Rest of Latin America), Middle East & Africa (Saudi Arabia, UAE, Rest of Middle East & Africa) |
|
Major Companies |
Siemens AG, ABB Group, Schneider Electric, ChargePoint, Inc., EVBox, Wallbox Chargers, Blink Charging Co., Tesla, Inc., AeroVironment, Inc., Enel X, Greenlots, BYD Company, Bosch Automotive, Volta Charging, Engie SA |
|
Customization Scope |
Customization for segments, region/country-level will be provided. Moreover, additional customization can be done based on the requirements |
|
1. Introduction |
|
1.1. Market Definition |
|
1.2. Scope of the Study |
|
1.3. Research Assumptions |
|
1.4. Study Limitations |
|
2. Research Methodology |
|
2.1. Research Approach |
|
2.1.1. Top-Down Method |
|
2.1.2. Bottom-Up Method |
|
2.1.3. Factor Impact Analysis |
|
2.2. Insights & Data Collection Process |
|
2.2.1. Secondary Research |
|
2.2.2. Primary Research |
|
2.3. Data Mining Process |
|
2.3.1. Data Analysis |
|
2.3.2. Data Validation and Revalidation |
|
2.3.3. Data Triangulation |
|
3. Executive Summary |
|
3.1. Major Markets & Segments |
|
3.2. Highest Growing Regions and Respective Countries |
|
3.3. Impact of Growth Drivers & Inhibitors |
|
3.4. Regulatory Overview by Country |
|
4. Micro Mobility Charging Infrastructure Market, by Charging Type (Market Size & Forecast: USD Million, 2023 – 2030) |
|
4.1. AC Charging |
|
4.2. DC Fast Charging |
|
4.3. Wireless Charging |
|
4.4. Others |
|
5. Micro Mobility Charging Infrastructure Market, by Charging Station Type (Market Size & Forecast: USD Million, 2023 – 2030) |
|
5.1. Public Charging Stations |
|
5.2. Private Charging Stations |
|
5.3. Commercial Charging Stations |
|
5.4. Others |
|
6. Micro Mobility Charging Infrastructure Market, by End-Use Industry (Market Size & Forecast: USD Million, 2023 – 2030) |
|
6.1. Electric Scooters |
|
6.2. Electric Bicycles |
|
6.3. Electric Mopeds |
|
6.4. Others |
|
7. Regional Analysis (Market Size & Forecast: USD Million, 2023 – 2030) |
|
7.1. Regional Overview |
|
7.2. North America |
|
7.2.1. Regional Trends & Growth Drivers |
|
7.2.2. Barriers & Challenges |
|
7.2.3. Opportunities |
|
7.2.4. Factor Impact Analysis |
|
7.2.5. Technology Trends |
|
7.2.6. North America Micro Mobility Charging Infrastructure Market, by Charging Type |
|
7.2.7. North America Micro Mobility Charging Infrastructure Market, by Charging Station Type |
|
7.2.8. North America Micro Mobility Charging Infrastructure Market, by End-Use Industry |
|
7.2.9. By Country |
|
7.2.9.1. US |
|
7.2.9.1.1. US Micro Mobility Charging Infrastructure Market, by Charging Type |
|
7.2.9.1.2. US Micro Mobility Charging Infrastructure Market, by Charging Station Type |
|
7.2.9.1.3. US Micro Mobility Charging Infrastructure Market, by End-Use Industry |
|
7.2.9.2. Canada |
|
7.2.9.3. Mexico |
|
*Similar segmentation will be provided for each region and country |
|
7.3. Europe |
|
7.4. Asia-Pacific |
|
7.5. Latin America |
|
7.6. Middle East & Africa |
|
8. Competitive Landscape |
|
8.1. Overview of the Key Players |
|
8.2. Competitive Ecosystem |
|
8.2.1. Level of Fragmentation |
|
8.2.2. Market Consolidation |
|
8.2.3. Product Innovation |
|
8.3. Company Share Analysis |
|
8.4. Company Benchmarking Matrix |
|
8.4.1. Strategic Overview |
|
8.4.2. Product Innovations |
|
8.5. Start-up Ecosystem |
|
8.6. Strategic Competitive Insights/ Customer Imperatives |
|
8.7. ESG Matrix/ Sustainability Matrix |
|
8.8. Manufacturing Network |
|
8.8.1. Locations |
|
8.8.2. Supply Chain and Logistics |
|
8.8.3. Product Flexibility/Customization |
|
8.8.4. Digital Transformation and Connectivity |
|
8.8.5. Environmental and Regulatory Compliance |
|
8.9. Technology Readiness Level Matrix |
|
8.10. Technology Maturity Curve |
|
8.11. Buying Criteria |
|
9. Company Profiles |
|
9.1. Siemens AG |
|
9.1.1. Company Overview |
|
9.1.2. Company Financials |
|
9.1.3. Product/Service Portfolio |
|
9.1.4. Recent Developments |
|
9.1.5. IMR Analysis |
|
*Similar information will be provided for other companies |
|
9.2. ABB Group |
|
9.3. Schneider Electric |
|
9.4. ChargePoint, Inc. |
|
9.5. EVBox |
|
9.6. Wallbox Chargers |
|
9.7. Blink Charging Co. |
|
9.8. Tesla, Inc. |
|
9.9. AeroVironment, Inc. |
|
9.10. Enel X |
|
9.11. Greenlots |
|
9.12. BYD Company |
|
9.13. Bosch Automotive |
|
9.14. Volta Charging |
|
9.15. Engie SA |
|
10. Appendix |
A comprehensive market research approach was employed to gather and analyze data on the Micro Mobility Charging Infrastructure Market. In the process, the analysis was also done to analyze the parent market and relevant adjacencies to measure the impact of them on the Micro Mobility Charging Infrastructure Market. The research methodology encompassed both secondary and primary research techniques, ensuring the accuracy and credibility of the findings.
.jpg)
Secondary Research
Secondary research involved a thorough review of pertinent industry reports, journals, articles, and publications. Additionally, annual reports, press releases, and investor presentations of industry players were scrutinized to gain insights into their market positioning and strategies.
Primary Research
Primary research involved conducting in-depth interviews with industry experts, stakeholders, and market participants across the E-Waste Management ecosystem. The primary research objectives included:
- Validating findings and assumptions derived from secondary research
- Gathering qualitative and quantitative data on market trends, drivers, and challenges
- Understanding the demand-side dynamics, encompassing end-users, component manufacturers, facility providers, and service providers
- Assessing the supply-side landscape, including technological advancements and recent developments
Market Size Assessment
A combination of top-down and bottom-up approaches was utilized to analyze the overall size of the Micro Mobility Charging Infrastructure Market. These methods were also employed to assess the size of various subsegments within the market. The market size assessment methodology encompassed the following steps:
- Identification of key industry players and relevant revenues through extensive secondary research
- Determination of the industry's supply chain and market size, in terms of value, through primary and secondary research processes
- Calculation of percentage shares, splits, and breakdowns using secondary sources and verification through primary sources
.jpg)
Data Triangulation
To ensure the accuracy and reliability of the market size, data triangulation was implemented. This involved cross-referencing data from various sources, including demand and supply side factors, market trends, and expert opinions. Additionally, top-down and bottom-up approaches were employed to validate the market size assessment.
NA