As per Intent Market Research, the Label-Free Array Systems Market was valued at USD 2.8 Billion in 2024-e and will surpass USD 5.4 Billion by 2030; growing at a CAGR of 11.6% during 2025 - 2030.
The label-free array systems market has gained significant traction in recent years, driven by the increasing demand for advanced technologies in biomolecular analysis. Label-free techniques, which allow for the real-time monitoring of interactions without the need for labels or markers, offer distinct advantages over traditional methods, such as reduced complexity and enhanced sensitivity. These systems are critical in applications ranging from drug discovery to protein interaction analysis, enabling researchers to gain deeper insights into complex biological processes. The growing investment in biotechnology research and the rising need for more efficient drug development processes are key factors propelling the growth of this market.
As the market evolves, technological innovations and the demand for more precise and high-throughput analytical methods are driving the adoption of label-free array systems across various applications and industries. The ability of these systems to provide real-time, accurate data without the interference of labels has made them indispensable tools for researchers, particularly in the fields of drug discovery, biomarker identification, and clinical diagnostics. Furthermore, the market is expected to expand as industries such as pharmaceuticals and biotechnology continue to prioritize the development of more effective and targeted therapeutics.
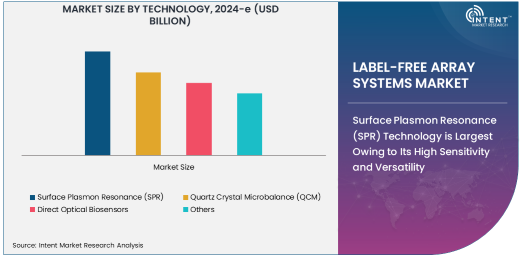
Surface Plasmon Resonance (SPR) Technology is Largest Owing to Its High Sensitivity and Versatility
Among the various technologies used in label-free array systems, Surface Plasmon Resonance (SPR) technology is the largest segment. SPR is widely adopted due to its ability to provide real-time, label-free detection of biomolecular interactions with high sensitivity and accuracy. This technology relies on the principle of surface plasmon resonance, where changes in the refractive index near a sensor surface, caused by the binding of molecules, are measured to determine the interaction between biomolecules. The versatility and sensitivity of SPR make it ideal for a wide range of applications, including drug discovery, protein interaction analysis, and biomarker identification.
The growing need for accurate, real-time measurements of molecular interactions, especially in the context of drug development and disease research, has bolstered the adoption of SPR technology. SPR-based label-free array systems are extensively used in both academic research and pharmaceutical development, where they facilitate high-throughput screening and the identification of potential drug candidates. With continued advancements in SPR technology, such as improvements in sensor surfaces and detection mechanisms, SPR is expected to maintain its position as the dominant technology in the label-free array systems market.
Drug Discovery is Fastest Growing Application Due to the Need for Efficient Screening Methods
Drug discovery is the fastest-growing application in the label-free array systems market, as the pharmaceutical industry increasingly demands efficient, high-throughput screening methods to identify potential drug candidates. Label-free array systems, particularly those utilizing SPR technology, offer a more streamlined approach to drug discovery by allowing researchers to observe molecular interactions in real time without the need for additional labels or reagents. This significantly accelerates the process of identifying promising compounds for further development.
The ability to screen large libraries of compounds quickly and accurately has made label-free array systems an invaluable tool in the drug discovery process. By enabling the direct monitoring of interactions between small molecules and target proteins, these systems improve the efficiency of hit identification, lead optimization, and biomarker discovery. As the demand for more personalized and targeted therapies increases, the use of label-free array systems in drug discovery will continue to rise, positioning it as the fastest-growing application segment within the market.
Pharmaceutical & Biotechnology Industry is Largest End-Use Industry Due to High Demand for Advanced Analytical Tools
The pharmaceutical and biotechnology industry is the largest end-use industry for label-free array systems, owing to the critical need for advanced tools to support drug discovery, protein interaction analysis, and biomarker research. These industries are at the forefront of developing novel therapeutics, and label-free array systems play a crucial role in enabling the discovery of new drug candidates and understanding the underlying biological mechanisms of diseases. The high demand for precision and efficiency in drug development processes has led to a surge in the adoption of these systems.
Pharmaceutical and biotechnology companies use label-free array systems in various stages of drug development, from early-stage screening to the optimization of lead compounds. The ability to assess molecular interactions in real time without requiring labels is particularly valuable in biopharmaceutical research, where rapid and accurate data is essential for success. As these industries continue to evolve and embrace new technologies, the demand for label-free array systems in pharmaceutical and biotechnology applications will remain robust, ensuring the industry remains the largest end-user of these advanced analytical tools.
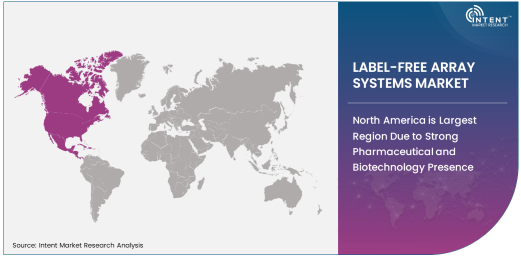
North America is Largest Region Due to Strong Pharmaceutical and Biotechnology Presence
North America is the largest region in the label-free array systems market, largely due to the strong presence of pharmaceutical and biotechnology companies, academic research institutions, and diagnostic laboratories. The region's well-established healthcare and research infrastructure, along with substantial investments in drug development and biotechnology research, contribute to its dominant position in the market. The United States, in particular, leads the adoption of label-free array systems, driven by the ongoing demand for more effective drug discovery methods and advanced molecular analysis tools.
In addition, North America's focus on innovation and technological advancements in the life sciences sector has fueled the growth of label-free array systems. The region benefits from a highly competitive market, with numerous companies offering state-of-the-art systems tailored to the needs of pharmaceutical, biotechnology, and academic research sectors. With continued investments in healthcare and research infrastructure, North America is expected to maintain its leadership in the label-free array systems market.
Competitive Landscape and Key Players
The label-free array systems market is highly competitive, with several key players striving to offer cutting-edge solutions that address the diverse needs of the pharmaceutical, biotechnology, and academic research sectors. Leading companies in the market include GE Healthcare, Bio-Rad Laboratories, Horiba Scientific, PerkinElmer, and FortéBio, a division of Pall Corporation. These companies are investing heavily in research and development to enhance the capabilities of their label-free array systems, with a particular focus on improving sensitivity, throughput, and ease of use.
The competitive landscape is marked by technological innovations, strategic partnerships, and acquisitions. Companies are expanding their product portfolios to offer a broader range of label-free array solutions and are increasingly focusing on improving the user experience and integrating advanced features such as automated workflows and cloud-based data analysis. As the demand for real-time biomolecular analysis continues to rise, these leading players are likely to maintain their competitive edge by advancing their technological offerings and expanding their market presence.
Recent Developments:
- Thermo Fisher Scientific Inc. launched a new surface plasmon resonance (SPR) system that offers enhanced sensitivity for drug discovery and biomolecular interaction studies.
- Bio-Techne Corporation introduced an innovative label-free biosensor technology designed for accelerated biomarker discovery and clinical diagnostics.
- Sartorius AG expanded its portfolio with new label-free sensor products aimed at improving real-time monitoring and protein interaction analysis in life science research.
- Agilent Technologies, Inc. received FDA approval for its label-free detection platform, optimizing molecular interaction analysis in pharmaceutical and diagnostics applications.
- PerkinElmer, Inc. announced the development of a new label-free optical biosensor aimed at enhancing drug development processes and enabling faster biomolecular screening.
List of Leading Companies:
- GE Healthcare
- Thermo Fisher Scientific Inc.
- PerkinElmer, Inc.
- Bio-Rad Laboratories, Inc.
- Bio-Techne Corporation
- Sartorius AG
- Roche Diagnostics
- Abbott Laboratories
- Hitachi High-Tech Corporation
- Danaher Corporation
- Yokogawa Electric Corporation
- Fujifilm Corporation
- Agilent Technologies, Inc.
- Hamamatsu Photonics K.K.
- Zeta Instruments
Report Scope:
|
Report Features |
Description |
|
Market Size (2024-e) |
USD 2.8 Billion |
|
Forecasted Value (2030) |
USD 5.4 Billion |
|
CAGR (2025 – 2030) |
11.6% |
|
Base Year for Estimation |
2024-e |
|
Historic Year |
2023 |
|
Forecast Period |
2025 – 2030 |
|
Report Coverage |
Market Forecast, Market Dynamics, Competitive Landscape, Recent Developments |
|
Segments Covered |
Global Label-Free Array Systems Market by Technology (Surface Plasmon Resonance (SPR), Quartz Crystal Microbalance (QCM), Direct Optical Biosensors), Application (Drug Discovery, Protein Interaction Analysis, Biomarker Discovery), End-Use Industry (Pharmaceutical & Biotechnology, Academic Research, Diagnostics) and By Region |
|
Regional Analysis |
North America (US, Canada, Mexico), Europe (Germany, France, UK, Italy, Spain, and Rest of Europe), Asia-Pacific (China, Japan, South Korea, Australia, India, and Rest of Asia-Pacific), Latin America (Brazil, Argentina, and Rest of Latin America), Middle East & Africa (Saudi Arabia, UAE, Rest of Middle East & Africa) |
|
Major Companies |
GE Healthcare, Thermo Fisher Scientific Inc., PerkinElmer, Inc., Bio-Rad Laboratories, Inc., Bio-Techne Corporation, Sartorius AG, Abbott Laboratories, Hitachi High-Tech Corporation, Danaher Corporation, Yokogawa Electric Corporation, Fujifilm Corporation, Agilent Technologies, Inc., Zeta Instruments |
|
Customization Scope |
Customization for segments, region/country-level will be provided. Moreover, additional customization can be done based on the requirements |
|
1. Introduction |
|
1.1. Market Definition |
|
1.2. Scope of the Study |
|
1.3. Research Assumptions |
|
1.4. Study Limitations |
|
2. Research Methodology |
|
2.1. Research Approach |
|
2.1.1. Top-Down Method |
|
2.1.2. Bottom-Up Method |
|
2.1.3. Factor Impact Analysis |
|
2.2. Insights & Data Collection Process |
|
2.2.1. Secondary Research |
|
2.2.2. Primary Research |
|
2.3. Data Mining Process |
|
2.3.1. Data Analysis |
|
2.3.2. Data Validation and Revalidation |
|
2.3.3. Data Triangulation |
|
3. Executive Summary |
|
3.1. Major Markets & Segments |
|
3.2. Highest Growing Regions and Respective Countries |
|
3.3. Impact of Growth Drivers & Inhibitors |
|
3.4. Regulatory Overview by Country |
|
4. Label-Free Array Systems Market, by Technology (Market Size & Forecast: USD Million, 2023 – 2030) |
|
4.1. Surface Plasmon Resonance (SPR) |
|
4.2. Quartz Crystal Microbalance (QCM) |
|
4.3. Direct Optical Biosensors |
|
4.4. Others |
|
5. Label-Free Array Systems Market, by Application (Market Size & Forecast: USD Million, 2023 – 2030) |
|
5.1. Drug Discovery |
|
5.2. Protein Interaction Analysis |
|
5.3. Biomarker Discovery |
|
5.4. Others |
|
6. Label-Free Array Systems Market, by End-Use Industry (Market Size & Forecast: USD Million, 2023 – 2030) |
|
6.1. Pharmaceutical & Biotechnology |
|
6.2. Academic Research |
|
6.3. Diagnostics |
|
6.4. Others |
|
7. Regional Analysis (Market Size & Forecast: USD Million, 2023 – 2030) |
|
7.1. Regional Overview |
|
7.2. North America |
|
7.2.1. Regional Trends & Growth Drivers |
|
7.2.2. Barriers & Challenges |
|
7.2.3. Opportunities |
|
7.2.4. Factor Impact Analysis |
|
7.2.5. Technology Trends |
|
7.2.6. North America Label-Free Array Systems Market, by Technology |
|
7.2.7. North America Label-Free Array Systems Market, by Application |
|
7.2.8. North America Label-Free Array Systems Market, by End-Use Industry |
|
7.2.9. By Country |
|
7.2.9.1. US |
|
7.2.9.1.1. US Label-Free Array Systems Market, by Technology |
|
7.2.9.1.2. US Label-Free Array Systems Market, by Application |
|
7.2.9.1.3. US Label-Free Array Systems Market, by End-Use Industry |
|
7.2.9.2. Canada |
|
7.2.9.3. Mexico |
|
*Similar segmentation will be provided for each region and country |
|
7.3. Europe |
|
7.4. Asia-Pacific |
|
7.5. Latin America |
|
7.6. Middle East & Africa |
|
8. Competitive Landscape |
|
8.1. Overview of the Key Players |
|
8.2. Competitive Ecosystem |
|
8.2.1. Level of Fragmentation |
|
8.2.2. Market Consolidation |
|
8.2.3. Product Innovation |
|
8.3. Company Share Analysis |
|
8.4. Company Benchmarking Matrix |
|
8.4.1. Strategic Overview |
|
8.4.2. Product Innovations |
|
8.5. Start-up Ecosystem |
|
8.6. Strategic Competitive Insights/ Customer Imperatives |
|
8.7. ESG Matrix/ Sustainability Matrix |
|
8.8. Manufacturing Network |
|
8.8.1. Locations |
|
8.8.2. Supply Chain and Logistics |
|
8.8.3. Product Flexibility/Customization |
|
8.8.4. Digital Transformation and Connectivity |
|
8.8.5. Environmental and Regulatory Compliance |
|
8.9. Technology Readiness Level Matrix |
|
8.10. Technology Maturity Curve |
|
8.11. Buying Criteria |
|
9. Company Profiles |
|
9.1. GE Healthcare |
|
9.1.1. Company Overview |
|
9.1.2. Company Financials |
|
9.1.3. Product/Service Portfolio |
|
9.1.4. Recent Developments |
|
9.1.5. IMR Analysis |
|
*Similar information will be provided for other companies |
|
9.2. Thermo Fisher Scientific Inc. |
|
9.3. PerkinElmer, Inc. |
|
9.4. Bio-Rad Laboratories, Inc. |
|
9.5. Bio-Techne Corporation |
|
9.6. Sartorius AG |
|
9.7. Roche Diagnostics |
|
9.8. Abbott Laboratories |
|
9.9. Hitachi High-Tech Corporation |
|
9.10. Danaher Corporation |
|
9.11. Yokogawa Electric Corporation |
|
9.12. Fujifilm Corporation |
|
9.13. Agilent Technologies, Inc. |
|
9.14. Hamamatsu Photonics K.K. |
|
9.15. Zeta Instruments |
|
10. Appendix |
A comprehensive market research approach was employed to gather and analyze data on the Label-Free Array Systems Market. In the process, the analysis was also done to analyze the parent market and relevant adjacencies to measure the impact of them on the Label-Free Array Systems Market. The research methodology encompassed both secondary and primary research techniques, ensuring the accuracy and credibility of the findings.
.jpg)
Secondary Research
Secondary research involved a thorough review of pertinent industry reports, journals, articles, and publications. Additionally, annual reports, press releases, and investor presentations of industry players were scrutinized to gain insights into their market positioning and strategies.
Primary Research
Primary research involved conducting in-depth interviews with industry experts, stakeholders, and market participants across the E-Waste Management ecosystem. The primary research objectives included:
- Validating findings and assumptions derived from secondary research
- Gathering qualitative and quantitative data on market trends, drivers, and challenges
- Understanding the demand-side dynamics, encompassing end-users, component manufacturers, facility providers, and service providers
- Assessing the supply-side landscape, including technological advancements and recent developments
Market Size Assessment
A combination of top-down and bottom-up approaches was utilized to analyze the overall size of the Label-Free Array Systems Market. These methods were also employed to assess the size of various subsegments within the market. The market size assessment methodology encompassed the following steps:
- Identification of key industry players and relevant revenues through extensive secondary research
- Determination of the industry's supply chain and market size, in terms of value, through primary and secondary research processes
- Calculation of percentage shares, splits, and breakdowns using secondary sources and verification through primary sources
.jpg)
Data Triangulation
To ensure the accuracy and reliability of the market size, data triangulation was implemented. This involved cross-referencing data from various sources, including demand and supply side factors, market trends, and expert opinions. Additionally, top-down and bottom-up approaches were employed to validate the market size assessment.
NA