As per Intent Market Research, the Internet of Things (IoT) in Agriculture Market was valued at USD 15.0 Billion in 2024-e and will surpass USD 27.0 Billion by 2030; growing at a CAGR of 10.3% during 2025-2030.
The Internet of Things (IoT) in agriculture is revolutionizing the way farming operations are conducted by integrating advanced technology with traditional agricultural practices. IoT solutions in agriculture enable farmers to monitor and optimize various aspects of their operations, such as soil moisture, crop health, and livestock conditions, using real-time data. By utilizing connected devices such as sensors, actuators, and controllers, IoT can streamline operations, improve yield efficiency, reduce waste, and enhance sustainability. As the global agricultural industry faces challenges such as climate change, resource scarcity, and labor shortages, the adoption of IoT technologies is expected to grow rapidly, driving significant changes in farming practices.
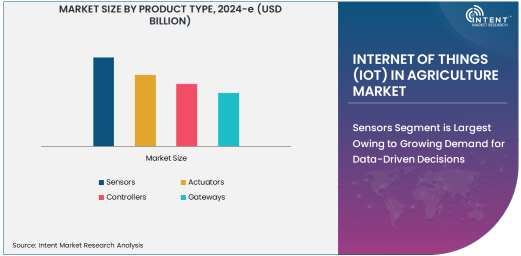
Sensors Segment is Largest Owing to Growing Demand for Data-Driven Decisions
The sensors segment is the largest within the IoT in agriculture market, driven by the increasing need for precision farming and data-driven decision-making. These sensors are pivotal in collecting real-time data on various environmental parameters, including soil moisture, temperature, humidity, and light intensity. Sensors play a critical role in enhancing crop yield by providing farmers with actionable insights that help in managing irrigation, fertilization, pest control, and crop rotation. Additionally, the data collected from these sensors can be integrated with machine learning algorithms to predict crop health and optimize inputs, further driving adoption across various farming operations.
With the growing trend towards smart farming, the demand for sensors is expected to continue to rise. In precision farming, for instance, IoT sensors enable farmers to make critical decisions based on accurate, real-time data, thus improving resource efficiency and productivity. As agricultural operations become more data-intensive, the integration of various sensor technologies such as soil moisture sensors, weather sensors, and crop health monitoring sensors will continue to gain importance.
Precision Farming Application is Fastest Growing Owing to Technological Advancements
Precision farming is the fastest-growing application within the IoT in agriculture market, as it enables farmers to optimize their inputs while maximizing yield. The integration of IoT solutions allows for precise monitoring of environmental conditions, which helps farmers make informed decisions regarding irrigation, fertilization, and pest control. These technologies reduce waste and increase crop yield, thereby contributing to the sustainability and profitability of farming operations. In addition to improving productivity, precision farming also supports environmental sustainability by reducing water consumption and minimizing the use of harmful chemicals, which is becoming increasingly important in modern agriculture.
The shift towards precision farming is driven by the growing adoption of advanced technologies like IoT, drones, and artificial intelligence (AI). IoT-based precision farming tools, such as soil sensors and automated irrigation systems, are becoming more affordable and accessible for farmers of all sizes. This trend is expected to accelerate as more farmers recognize the value of these technologies in enhancing operational efficiency and achieving long-term sustainability goals.
Crop Production End-User Industry is Largest Owing to Growing Global Demand for Food
Crop production is the largest end-user industry in the IoT in agriculture market, owing to the increasing global demand for food and the need for efficient farming practices. Crop production benefits significantly from IoT technologies as they enable farmers to monitor soil conditions, weather patterns, and crop health in real-time. With the world’s population expected to reach 9.7 billion by 2050, the demand for food will continue to rise, making it imperative to increase agricultural productivity. IoT solutions provide farmers with the tools necessary to improve crop yield while using fewer resources, making crop production more sustainable and efficient.
Moreover, the growing adoption of IoT in crop production aligns with trends in sustainable farming, where precision agriculture technologies help reduce input costs, improve yield, and minimize environmental impact. By integrating IoT-based solutions such as automated irrigation systems, nutrient management, and pest detection, crop production operations can achieve greater operational efficiency and profitability.
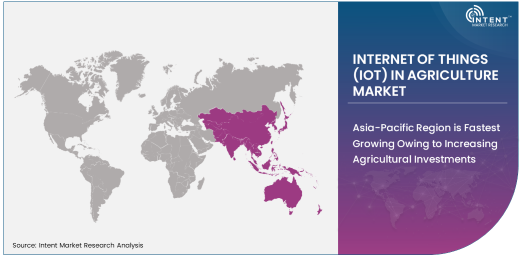
Asia-Pacific Region is Fastest Growing Owing to Increasing Agricultural Investments
The Asia-Pacific region is the fastest-growing in the IoT in agriculture market, driven by the increasing adoption of advanced farming technologies across countries like China, India, and Japan. As the region is home to the largest agricultural sector globally, the demand for IoT technologies is expected to grow rapidly as farmers seek to improve productivity and sustainability. Governments in these countries are investing heavily in agricultural modernization, creating a favorable environment for the growth of IoT solutions. Additionally, Asia-Pacific’s large and diverse agricultural landscape, combined with the need to improve food security, is propelling the adoption of IoT in farming operations.
Asia-Pacific's growth is also fueled by the increasing awareness of the benefits of precision farming, especially in countries like India, where farmers are adopting IoT technologies to optimize water usage and improve crop yields. As technological advancements continue to make IoT solutions more affordable and accessible, the adoption of IoT technologies in agriculture is expected to expand significantly in this region.
Leading Companies and Competitive Landscape
The IoT in agriculture market is highly competitive, with several companies driving technological innovation and transforming agricultural practices. Leading players include Deere & Company, Trimble Inc., and The Climate Corporation, which are at the forefront of providing IoT solutions for precision farming, livestock monitoring, and crop management. These companies are investing heavily in research and development to create cutting-edge IoT solutions that enhance farm productivity and sustainability. Partnerships and acquisitions are common strategies used by these companies to expand their product offerings and strengthen their market position.
The competitive landscape is also marked by the presence of emerging players such as Farmers Edge, eFishery, and Semios, which are leveraging advanced technologies like artificial intelligence, machine learning, and data analytics to offer innovative IoT solutions. These companies are focusing on providing comprehensive farm management solutions that integrate IoT sensors, data analytics, and cloud platforms. As the IoT in agriculture market continues to grow, companies that can offer scalable, cost-effective, and easy-to-use solutions will likely lead the market.
Recent Developments:
- Deere & Company announced the launch of a new line of IoT-enabled tractors designed to enhance precision farming capabilities.
- Trimble Inc. acquired a leading agricultural drone company to expand its IoT-based crop monitoring solutions.
- The Climate Corporation introduced a cloud-based platform integrating IoT data for comprehensive farm management.
- Farmers Edge secured a strategic partnership with a major agribusiness to deploy IoT solutions across large-scale farms.
- eFishery received regulatory approval for its IoT-based automated feeding system, set to revolutionize fish farming practices.
List of Leading Companies:
- Deere & Company
- Trimble Inc.
- The Climate Corporation
- Farmers Edge
- eFishery
- Semios
- Fyllo
- AG Leader Technology
- Raven Industries
- Topcon Positioning Systems
- AG Leader Technology
- Trimble Ag Software
- John Deere
- Trimble Ag Software
- AG Leader Technology
Report Scope:
|
Report Features |
Description |
|
Market Size (2024-e) |
USD 15.0 Billion |
|
Forecasted Value (2030) |
USD 27.0 Billion |
|
CAGR (2025 – 2030) |
10.3% |
|
Base Year for Estimation |
2024-e |
|
Historic Year |
2023 |
|
Forecast Period |
2025 – 2030 |
|
Report Coverage |
Market Forecast, Market Dynamics, Competitive Landscape, Recent Developments |
|
Segments Covered |
Internet of Things (IoT) Market By Product Type (Sensors, Actuators, Controllers, Gateways), By Application (Precision Farming, Livestock Monitoring, Smart Greenhouses, Fish Farm Monitoring), By End-User Industry (Crop Production, Livestock Farming, Aquaculture, Dairy Farming) |
|
Regional Analysis |
North America (US, Canada, Mexico), Europe (Germany, France, UK, Italy, Spain, and Rest of Europe), Asia-Pacific (China, Japan, South Korea, Australia, India, and Rest of Asia-Pacific), Latin America (Brazil, Argentina, and Rest of Latin America), Middle East & Africa (Saudi Arabia, UAE, Rest of Middle East & Africa) |
|
Major Companies |
Deere & Company, Trimble Inc., The Climate Corporation, Farmers Edge, eFishery, Semios, Fyllo, AG Leader Technology, Raven Industries, Topcon Positioning Systems, AG Leader Technology, Trimble Ag Software, John Deere, Trimble Ag Software, AG Leader Technology |
|
Customization Scope |
Customization for segments, region/country-level will be provided. Moreover, additional customization can be done based on the requirements |
|
1. Introduction |
|
1.1. Market Definition |
|
1.2. Scope of the Study |
|
1.3. Research Assumptions |
|
1.4. Study Limitations |
|
2. Research Methodology |
|
2.1. Research Approach |
|
2.1.1. Top-Down Method |
|
2.1.2. Bottom-Up Method |
|
2.1.3. Factor Impact Analysis |
|
2.2. Insights & Data Collection Process |
|
2.2.1. Secondary Research |
|
2.2.2. Primary Research |
|
2.3. Data Mining Process |
|
2.3.1. Data Analysis |
|
2.3.2. Data Validation and Revalidation |
|
2.3.3. Data Triangulation |
|
3. Executive Summary |
|
3.1. Major Markets & Segments |
|
3.2. Highest Growing Regions and Respective Countries |
|
3.3. Impact of Growth Drivers & Inhibitors |
|
3.4. Regulatory Overview by Country |
|
4. Internet of Things (IoT) in Agriculture Market, by Product Type (Market Size & Forecast: USD Million, 2023 – 2030) |
|
4.1. Sensors |
|
4.2. Actuators |
|
4.3. Controllers |
|
4.4. Gateways |
|
5. Internet of Things (IoT) in Agriculture Market, by Application (Market Size & Forecast: USD Million, 2023 – 2030) |
|
5.1. Precision Farming |
|
5.2. Livestock Monitoring |
|
5.3. Smart Greenhouses |
|
5.4. Fish Farm Monitoring |
|
6. Internet of Things (IoT) in Agriculture Market, by End-User Industry (Market Size & Forecast: USD Million, 2023 – 2030) |
|
6.1. Crop Production |
|
6.2. Livestock Farming |
|
6.3. Aquaculture |
|
6.4. Dairy Farming |
|
7. Regional Analysis (Market Size & Forecast: USD Million, 2023 – 2030) |
|
7.1. Regional Overview |
|
7.2. North America |
|
7.2.1. Regional Trends & Growth Drivers |
|
7.2.2. Barriers & Challenges |
|
7.2.3. Opportunities |
|
7.2.4. Factor Impact Analysis |
|
7.2.5. Technology Trends |
|
7.2.6. North America Internet of Things (IoT) in Agriculture Market, by Product Type |
|
7.2.7. North America Internet of Things (IoT) in Agriculture Market, by Application |
|
7.2.8. North America Internet of Things (IoT) in Agriculture Market, by End-User Industry |
|
7.2.9. By Country |
|
7.2.9.1. US |
|
7.2.9.1.1. US Internet of Things (IoT) in Agriculture Market, by Product Type |
|
7.2.9.1.2. US Internet of Things (IoT) in Agriculture Market, by Application |
|
7.2.9.1.3. US Internet of Things (IoT) in Agriculture Market, by End-User Industry |
|
7.2.9.2. Canada |
|
7.2.9.3. Mexico |
|
*Similar segmentation will be provided for each region and country |
|
7.3. Europe |
|
7.4. Asia-Pacific |
|
7.5. Latin America |
|
7.6. Middle East & Africa |
|
8. Competitive Landscape |
|
8.1. Overview of the Key Players |
|
8.2. Competitive Ecosystem |
|
8.2.1. Level of Fragmentation |
|
8.2.2. Market Consolidation |
|
8.2.3. Product Innovation |
|
8.3. Company Share Analysis |
|
8.4. Company Benchmarking Matrix |
|
8.4.1. Strategic Overview |
|
8.4.2. Product Innovations |
|
8.5. Start-up Ecosystem |
|
8.6. Strategic Competitive Insights/ Customer Imperatives |
|
8.7. ESG Matrix/ Sustainability Matrix |
|
8.8. Manufacturing Network |
|
8.8.1. Locations |
|
8.8.2. Supply Chain and Logistics |
|
8.8.3. Product Flexibility/Customization |
|
8.8.4. Digital Transformation and Connectivity |
|
8.8.5. Environmental and Regulatory Compliance |
|
8.9. Technology Readiness Level Matrix |
|
8.10. Technology Maturity Curve |
|
8.11. Buying Criteria |
|
9. Company Profiles |
|
9.1. Deere & Company |
|
9.1.1. Company Overview |
|
9.1.2. Company Financials |
|
9.1.3. Product/Service Portfolio |
|
9.1.4. Recent Developments |
|
9.1.5. IMR Analysis |
|
*Similar information will be provided for other companies |
|
9.2. Trimble Inc. |
|
9.3. The Climate Corporation |
|
9.4. Farmers Edge |
|
9.5. eFishery |
|
9.6. Semios |
|
9.7. Fyllo |
|
9.8. AG Leader Technology |
|
9.9. Raven Industries |
|
9.10. Topcon Positioning Systems |
|
9.11. AG Leader Technology |
|
9.12. Trimble Ag Software |
|
9.13. John Deere |
|
9.14. Trimble Ag Software |
|
9.15. AG Leader Technology |
|
10. Appendix |
A comprehensive market research approach was employed to gather and analyze data on the Internet of Things (IoT) in Agriculture Market. In the process, the analysis was also done to analyze the parent market and relevant adjacencies to measure the impact of them on the Internet of Things (IoT) in Agriculture Market. The research methodology encompassed both secondary and primary research techniques, ensuring the accuracy and credibility of the findings.
.jpg)
Secondary Research
Secondary research involved a thorough review of pertinent industry reports, journals, articles, and publications. Additionally, annual reports, press releases, and investor presentations of industry players were scrutinized to gain insights into their market positioning and strategies.
Primary Research
Primary research involved conducting in-depth interviews with industry experts, stakeholders, and market participants across the E-Waste Management ecosystem. The primary research objectives included:
- Validating findings and assumptions derived from secondary research
- Gathering qualitative and quantitative data on market trends, drivers, and challenges
- Understanding the demand-side dynamics, encompassing end-users, component manufacturers, facility providers, and service providers
- Assessing the supply-side landscape, including technological advancements and recent developments
Market Size Assessment
A combination of top-down and bottom-up approaches was utilized to analyze the overall size of the Internet of Things (IoT) in Agriculture Market. These methods were also employed to assess the size of various subsegments within the market. The market size assessment methodology encompassed the following steps:
- Identification of key industry players and relevant revenues through extensive secondary research
- Determination of the industry's supply chain and market size, in terms of value, through primary and secondary research processes
- Calculation of percentage shares, splits, and breakdowns using secondary sources and verification through primary sources
.jpg)
Data Triangulation
To ensure the accuracy and reliability of the market size, data triangulation was implemented. This involved cross-referencing data from various sources, including demand and supply side factors, market trends, and expert opinions. Additionally, top-down and bottom-up approaches were employed to validate the market size assessment.
NA