As per Intent Market Research, the Industrial Metaverse Market was valued at USD 15.3 Billion in 2024-e and will surpass USD 84.6 Billion by 2030; growing at a CAGR of 33.0% during 2025-2030.
The industrial metaverse is an emerging market that is revolutionizing the way industries approach operations, training, and collaboration. By leveraging immersive technologies such as Virtual Reality (VR), Augmented Reality (AR), Mixed Reality (MR), and Extended Reality (XR), industries can create digital twins, simulate environments, and optimize processes in real time. The integration of the industrial metaverse offers unparalleled opportunities for improving productivity, reducing operational costs, and enhancing worker safety. As industries continue to embrace digital transformation, the industrial metaverse plays a crucial role in reshaping manufacturing processes, enhancing supply chain management, and facilitating remote work and collaboration. The market is expected to grow significantly as more sectors explore the benefits of immersive technologies to streamline their operations and foster innovation.
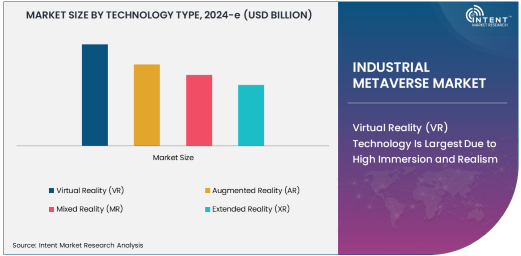
Virtual Reality (VR) Technology Is Largest Due to High Immersion and Realism
Among the various immersive technologies, Virtual Reality (VR) is the largest segment within the industrial metaverse market. VR offers highly immersive and interactive experiences by creating fully digital environments where users can engage with and manipulate virtual objects. This makes it particularly valuable in applications such as equipment maintenance, training and simulation, and design and prototyping. VR enables workers to experience realistic simulations of real-world operations, which is especially beneficial for training purposes, as it allows them to practice complex procedures in a controlled virtual environment without the risks associated with physical operations.
The widespread adoption of VR in industries such as aerospace, automotive, and healthcare is driving its dominance in the market. By improving training outcomes and minimizing downtime, VR is proving to be a cost-effective and efficient tool for organizations. Additionally, as VR technology continues to advance with better hardware and more realistic simulations, its potential to transform industrial processes further amplifies its prominence in the industrial metaverse landscape.
Training & Simulation Is Fastest Growing Application Due to Demand for Safe, Cost-Effective Learning
Training and simulation is the fastest-growing application in the industrial metaverse market. As industries face the challenge of upskilling their workforce, training solutions powered by the industrial metaverse offer a safe and cost-effective way to educate employees on complex machinery, hazardous environments, and emergency response protocols. Immersive technologies like VR and AR provide lifelike simulations, allowing employees to practice without the risks and costs associated with traditional hands-on training.
The growth of training and simulation applications is fueled by the need for industries to adapt quickly to technological advancements and improve worker efficiency. In industries such as automotive, aerospace, and healthcare, where precision and safety are paramount, virtual training environments enable workers to hone their skills before applying them in real-world situations. As the demand for skilled labor rises, the industrial metaverse's ability to enhance training experiences will continue to drive its rapid growth in the market.
Automotive Sector Leads the Market Due to Innovation in Design, Prototyping, and Maintenance
The automotive industry is one of the leading sectors in the industrial metaverse market. As automotive companies embrace digital transformation, they are increasingly turning to the metaverse to improve design processes, streamline production workflows, and enhance maintenance protocols. The ability to create and test digital prototypes in a virtual environment allows manufacturers to reduce development time and costs while ensuring the highest levels of quality and performance. Additionally, the automotive industry leverages AR and VR technologies for equipment maintenance, where technicians can receive real-time data and guidance while working on complex machinery.
With the growing demand for electric vehicles (EVs) and autonomous driving technologies, the automotive industry is at the forefront of adopting metaverse technologies to accelerate innovation. From virtual testing environments to remote collaboration, the industrial metaverse enables automakers to stay ahead in an increasingly competitive market. This sector's rapid adoption of immersive technologies will continue to fuel growth in the industrial metaverse market, making it a key driver of the market's expansion.
North America Region Leads Due to Advanced Technological Adoption and Strong Industrial Base
North America is the largest region in the industrial metaverse market, owing to its advanced technological infrastructure and strong industrial base. The region is home to many key players in industries such as automotive, aerospace, healthcare, and energy, all of which are early adopters of immersive technologies. The presence of leading tech companies and innovative startups in the region further accelerates the development and deployment of industrial metaverse solutions. North American companies are increasingly using the industrial metaverse to enhance manufacturing processes, improve equipment maintenance, and offer immersive training experiences.
The United States, in particular, stands out as a major hub for research and development in the metaverse space, with significant investments in XR and AR/VR technologies. As industries continue to invest in digital transformation initiatives, North America’s position as a leader in the industrial metaverse market is expected to remain strong, driving innovation and setting the pace for global adoption.

Leading Companies and Competitive Landscape
The industrial metaverse market is highly competitive, with numerous players driving technological innovation and strategic partnerships to offer cutting-edge solutions. Key companies in the market include Meta Platforms Inc., Microsoft, Google, NVIDIA, and Unity Technologies, which are at the forefront of providing AR, VR, and XR solutions for industrial applications. These companies focus on enhancing user experiences, improving hardware capabilities, and developing tailored software platforms that meet the unique needs of various industries.
The competitive landscape is also characterized by collaborations between technology providers and industry leaders. Partnerships between software developers, hardware manufacturers, and end-user industries are crucial for creating comprehensive metaverse ecosystems that offer seamless integration of immersive technologies. As industries continue to embrace the industrial metaverse for training, design, and operational optimization, the market will likely see further consolidation and innovation from key players aiming to capture market share and meet the growing demand for immersive industrial solutions.
Recent Developments:
- Microsoft Corporation introduced a new industrial metaverse platform that integrates AR and VR for real-time manufacturing process optimization.
- Meta Platforms, Inc. launched a new suite of tools designed for remote collaboration and virtual industrial training within the metaverse.
- NVIDIA Corporation announced advancements in AI-powered simulations and digital twins for industrial applications within the industrial metaverse.
- Siemens AG revealed plans to expand its industrial metaverse ecosystem, targeting applications in factory automation and digital twin technologies.
- PTC Inc. partnered with several automotive manufacturers to create virtual environments for automotive design and testing within the industrial metaverse.
List of Leading Companies:
- Microsoft Corporation
- Meta Platforms, Inc.
- NVIDIA Corporation
- Unity Technologies
- Epic Games, Inc.
- Siemens AG
- PTC Inc.
- Honeywell International Inc.
- Bosch Group
- IBM Corporation
- Schneider Electric
- Dassault Systèmes
- Autodesk, Inc.
- Trimble Inc.
- Ericsson
Report Scope:
|
Report Features |
Description |
|
Market Size (2024-e) |
USD 15.3 Billion |
|
Forecasted Value (2030) |
USD 84.6 Billion |
|
CAGR (2025 – 2030) |
33.0% |
|
Base Year for Estimation |
2024-e |
|
Historic Year |
2023 |
|
Forecast Period |
2025 – 2030 |
|
Report Coverage |
Market Forecast, Market Dynamics, Competitive Landscape, Recent Developments |
|
Segments Covered |
Industrial Metaverse Market By Technology Type (Virtual Reality, Augmented Reality, Mixed Reality, Extended Reality), By Application (Manufacturing & Production, Supply Chain Management, Equipment Maintenance, Training & Simulation, Remote Work & Collaboration, Design & Prototyping, Quality Control & Inspection) and By End-Use Industry (Automotive, Aerospace & Defense, Healthcare, Energy & Utilities, Consumer Electronics, Industrial Equipment, Mining, Oil & Gas) |
|
Regional Analysis |
North America (US, Canada, Mexico), Europe (Germany, France, UK, Italy, Spain, and Rest of Europe), Asia-Pacific (China, Japan, South Korea, Australia, India, and Rest of Asia-Pacific), Latin America (Brazil, Argentina, and Rest of Latin America), Middle East & Africa (Saudi Arabia, UAE, Rest of Middle East & Africa) |
|
Major Companies |
Microsoft Corporation, Meta Platforms, Inc., NVIDIA Corporation, Unity Technologies, Epic Games, Inc., Siemens AG, PTC Inc., Honeywell International Inc., Bosch Group, IBM Corporation, Schneider Electric, Dassault Systèmes, Autodesk, Inc., Trimble Inc., Ericsson |
|
Customization Scope |
Customization for segments, region/country-level will be provided. Moreover, additional customization can be done based on the requirements |
|
1. Introduction |
|
1.1. Market Definition |
|
1.2. Scope of the Study |
|
1.3. Research Assumptions |
|
1.4. Study Limitations |
|
2. Research Methodology |
|
2.1. Research Approach |
|
2.1.1. Top-Down Method |
|
2.1.2. Bottom-Up Method |
|
2.1.3. Factor Impact Analysis |
|
2.2. Insights & Data Collection Process |
|
2.2.1. Secondary Research |
|
2.2.2. Primary Research |
|
2.3. Data Mining Process |
|
2.3.1. Data Analysis |
|
2.3.2. Data Validation and Revalidation |
|
2.3.3. Data Triangulation |
|
3. Executive Summary |
|
3.1. Major Markets & Segments |
|
3.2. Highest Growing Regions and Respective Countries |
|
3.3. Impact of Growth Drivers & Inhibitors |
|
3.4. Regulatory Overview by Country |
|
4. Industrial Metaverse Market, by Technology Type (Market Size & Forecast: USD Million, 2023 – 2030) |
|
4.1. Virtual Reality (VR) |
|
4.2. Augmented Reality (AR) |
|
4.3. Mixed Reality (MR) |
|
4.4. Extended Reality (XR) |
|
5. Industrial Metaverse Market, by Application (Market Size & Forecast: USD Million, 2023 – 2030) |
|
5.1. Manufacturing & Production |
|
5.2. Supply Chain Management |
|
5.3. Equipment Maintenance |
|
5.4. Training & Simulation |
|
5.5. Remote Work & Collaboration |
|
5.6. Design & Prototyping |
|
5.7. Quality Control & Inspection |
|
5.8. Other Applications |
|
6. Industrial Metaverse Market, by End-Use Industry (Market Size & Forecast: USD Million, 2023 – 2030) |
|
6.1. Automotive |
|
6.2. Aerospace & Defense |
|
6.3. Healthcare |
|
6.4. Energy & Utilities |
|
6.5. Consumer Electronics |
|
6.6. Industrial Equipment |
|
6.7. Mining |
|
6.8. Oil & Gas |
|
6.9. Other Industries |
|
7. Regional Analysis (Market Size & Forecast: USD Million, 2023 – 2030) |
|
7.1. Regional Overview |
|
7.2. North America |
|
7.2.1. Regional Trends & Growth Drivers |
|
7.2.2. Barriers & Challenges |
|
7.2.3. Opportunities |
|
7.2.4. Factor Impact Analysis |
|
7.2.5. Technology Trends |
|
7.2.6. North America Industrial Metaverse Market, by Technology Type |
|
7.2.7. North America Industrial Metaverse Market, by Application |
|
7.2.8. North America Industrial Metaverse Market, by End-Use Industry |
|
7.2.9. By Country |
|
7.2.9.1. US |
|
7.2.9.1.1. US Industrial Metaverse Market, by Technology Type |
|
7.2.9.1.2. US Industrial Metaverse Market, by Application |
|
7.2.9.1.3. US Industrial Metaverse Market, by End-Use Industry |
|
7.2.9.2. Canada |
|
7.2.9.3. Mexico |
|
*Similar segmentation will be provided for each region and country |
|
7.3. Europe |
|
7.4. Asia-Pacific |
|
7.5. Latin America |
|
7.6. Middle East & Africa |
|
8. Competitive Landscape |
|
8.1. Overview of the Key Players |
|
8.2. Competitive Ecosystem |
|
8.2.1. Level of Fragmentation |
|
8.2.2. Market Consolidation |
|
8.2.3. Product Innovation |
|
8.3. Company Share Analysis |
|
8.4. Company Benchmarking Matrix |
|
8.4.1. Strategic Overview |
|
8.4.2. Product Innovations |
|
8.5. Start-up Ecosystem |
|
8.6. Strategic Competitive Insights/ Customer Imperatives |
|
8.7. ESG Matrix/ Sustainability Matrix |
|
8.8. Manufacturing Network |
|
8.8.1. Locations |
|
8.8.2. Supply Chain and Logistics |
|
8.8.3. Product Flexibility/Customization |
|
8.8.4. Digital Transformation and Connectivity |
|
8.8.5. Environmental and Regulatory Compliance |
|
8.9. Technology Readiness Level Matrix |
|
8.10. Technology Maturity Curve |
|
8.11. Buying Criteria |
|
9. Company Profiles |
|
9.1. Microsoft Corporation |
|
9.1.1. Company Overview |
|
9.1.2. Company Financials |
|
9.1.3. Product/Service Portfolio |
|
9.1.4. Recent Developments |
|
9.1.5. IMR Analysis |
|
*Similar information will be provided for other companies |
|
9.2. Meta Platforms, Inc. |
|
9.3. NVIDIA Corporation |
|
9.4. Unity Technologies |
|
9.5. Epic Games, Inc. |
|
9.6. Siemens AG |
|
9.7. PTC Inc. |
|
9.8. Honeywell International Inc. |
|
9.9. Bosch Group |
|
9.10. IBM Corporation |
|
9.11. Schneider Electric |
|
9.12. Dassault Systèmes |
|
9.13. Autodesk, Inc. |
|
9.14. Trimble Inc. |
|
9.15. Ericsson |
|
10. Appendix |
A comprehensive market research approach was employed to gather and analyze data on the Industrial Metaverse Market. In the process, the analysis was also done to analyze the parent market and relevant adjacencies to measure the impact of them on the Industrial Metaverse Market. The research methodology encompassed both secondary and primary research techniques, ensuring the accuracy and credibility of the findings.
.jpg)
Secondary Research
Secondary research involved a thorough review of pertinent industry reports, journals, articles, and publications. Additionally, annual reports, press releases, and investor presentations of industry players were scrutinized to gain insights into their market positioning and strategies.
Primary Research
Primary research involved conducting in-depth interviews with industry experts, stakeholders, and market participants across the E-Waste Management ecosystem. The primary research objectives included:
- Validating findings and assumptions derived from secondary research
- Gathering qualitative and quantitative data on market trends, drivers, and challenges
- Understanding the demand-side dynamics, encompassing end-users, component manufacturers, facility providers, and service providers
- Assessing the supply-side landscape, including technological advancements and recent developments
Market Size Assessment
A combination of top-down and bottom-up approaches was utilized to analyze the overall size of the Industrial Metaverse Market. These methods were also employed to assess the size of various subsegments within the market. The market size assessment methodology encompassed the following steps:
- Identification of key industry players and relevant revenues through extensive secondary research
- Determination of the industry's supply chain and market size, in terms of value, through primary and secondary research processes
- Calculation of percentage shares, splits, and breakdowns using secondary sources and verification through primary sources
.jpg)
Data Triangulation
To ensure the accuracy and reliability of the market size, data triangulation was implemented. This involved cross-referencing data from various sources, including demand and supply side factors, market trends, and expert opinions. Additionally, top-down and bottom-up approaches were employed to validate the market size assessment.
NA