As per Intent Market Research, the Gap Conductor Market was valued at USD 1.0 billion in 2023 and will surpass USD 1.5 billion by 2030; growing at a CAGR of 5.2% during 2024 - 2030.
The gap conductor market is driven by the growing need for reliable, high-capacity electrical transmission systems and the increasing demand for advanced power distribution solutions. Gap conductors, used in various applications such as power lines, smart grids, and communication networks, are critical components in ensuring the efficient transmission of electricity and data. With the rise of renewable energy sources and the expansion of industrial and infrastructural projects, the market for gap conductors is witnessing substantial growth. Additionally, technological advancements are paving the way for more durable, high-performance conductors that can handle higher loads and reduce power losses.
As the global energy infrastructure evolves, gap conductors are playing a vital role in modernizing grids, ensuring stable and efficient transmission of electricity over long distances. Innovations in conductor materials and voltage types are making these solutions increasingly efficient and cost-effective, with a shift toward lightweight, corrosion-resistant materials. This evolution is particularly significant as the market embraces the development of smart grids and the electrification of transportation systems, including rail networks, which require robust conductor solutions to meet growing demands.
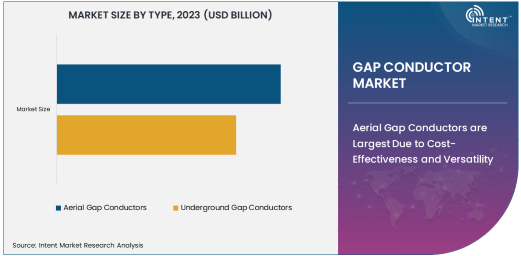
Aerial Gap Conductors are Largest Due to Cost-Effectiveness and Versatility
Aerial gap conductors are the largest segment in the gap conductor market due to their cost-effectiveness, easy installation, and ability to cover vast distances without the need for extensive underground infrastructure. Aerial conductors are widely used in overhead power transmission lines, where they provide reliable electricity delivery across both urban and rural areas. These conductors are also used in communication lines, enabling the efficient transmission of data over large distances. The advantages of aerial gap conductors, such as lower installation and maintenance costs, have made them the preferred choice for utilities and telecom companies looking to improve network reliability and reduce costs.
Furthermore, aerial gap conductors are ideal for areas with challenging terrains or limited access to underground pathways, such as mountainous regions. The growing demand for high-voltage transmission networks, especially in developing regions, is further boosting the adoption of aerial gap conductors. With their ability to be quickly deployed and the ongoing development of more durable materials, this segment will remain the largest in the gap conductor market.
Aluminum Alloy Conductor Material is Fastest Growing Due to Improved Performance and Durability
Aluminum alloy conductors are the fastest-growing material segment in the gap conductor market, driven by the combination of improved performance, durability, and cost-effectiveness. Aluminum alloys, which offer a lighter weight compared to traditional copper conductors, are being increasingly used for both high and medium voltage applications. These alloys provide enhanced mechanical strength, corrosion resistance, and higher conductivity, making them an attractive alternative to other materials in power transmission and distribution networks.
As industries seek more efficient solutions that reduce energy loss and increase overall transmission capacity, aluminum alloy conductors are gaining traction in both aerial and underground applications. Their ability to withstand harsh environmental conditions, while offering reduced installation and maintenance costs, makes them ideal for use in smart grid systems, renewable energy integration, and large-scale power transmission networks. The growing focus on sustainability and energy efficiency will further drive the demand for aluminum alloy conductors, positioning this material as the fastest-growing segment.
High Voltage Application is Largest Due to Growing Power Transmission Demand
High voltage gap conductors are the largest application segment, driven by the increasing demand for long-distance power transmission, especially in regions with rapidly growing energy needs. High voltage conductors are essential for transporting large amounts of electricity from power plants to substations and end-users. These conductors are critical in ensuring that the power grid operates efficiently and with minimal energy loss over long distances. The development of modern electrical grids, the expansion of renewable energy sources, and the growing need for energy security are all contributing factors to the increasing adoption of high voltage gap conductors.
High voltage conductors also play a crucial role in smart grid systems, where the transmission of electricity needs to be optimized to accommodate varying energy loads. As countries work toward energy transition goals, including the integration of renewable energy and electrification of transportation, the demand for high voltage gap conductors will continue to rise. Their ability to manage large power flows with minimal losses makes high voltage gap conductors the largest and most crucial segment in the market.
Power Transmission End-Use Industry is Leading Due to Increased Infrastructure Investment
The power transmission end-use industry is the leading sector in the gap conductor market, driven by significant investments in power grid infrastructure worldwide. As countries modernize their electricity grids to accommodate growing demand and integrate renewable energy sources, the need for efficient, reliable gap conductors for power transmission becomes more critical. Power transmission networks require robust, high-performance conductors to ensure a stable and continuous flow of electricity across large geographical areas, connecting power plants with consumers.
With the global focus on improving energy access, particularly in emerging markets, and the continued expansion of renewable energy infrastructure, the power transmission sector will remain the dominant end-use industry for gap conductors. Additionally, the growth of electric vehicle infrastructure, which relies on efficient power distribution systems, will further fuel the demand for gap conductors in power transmission networks.
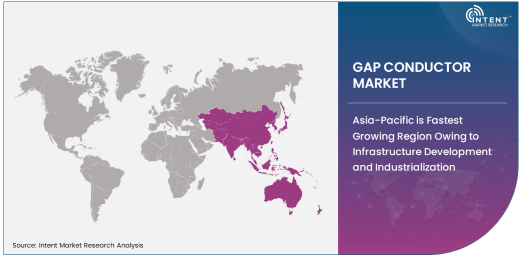
Asia-Pacific is Fastest Growing Region Owing to Infrastructure Development and Industrialization
Asia-Pacific is the fastest-growing region in the gap conductor market, driven by rapid urbanization, infrastructure development, and increasing industrialization in countries such as China, India, and Southeast Asia. As these nations continue to expand their energy infrastructure to meet the demands of their growing populations and industrial sectors, the need for efficient power transmission solutions, including gap conductors, is rising. Additionally, the integration of smart grid systems, which require advanced conductor technologies, is further accelerating market growth in the region.
The region's focus on renewable energy generation and electrification of transportation, including the expansion of rail networks, is also fueling the demand for reliable, high-capacity conductors. With significant investments in energy and communication infrastructure, Asia-Pacific will remain a key player in the gap conductor market, with demand expected to increase in line with the region's ongoing economic growth and energy transition initiatives.
Leading Companies and Competitive Landscape
The gap conductor market is highly competitive, with several key players leading the way in offering innovative solutions for power transmission, telecommunications, and energy storage systems. Prominent companies include Prysmian Group, Nexans, Southwire Company, and General Cable (now part of Prysmian). These companies are focused on developing high-performance conductors made from materials like aluminum alloys, copper, and other advanced materials that improve efficiency and reduce energy loss.
The competitive landscape is marked by a strong emphasis on research and development to create more durable, lightweight, and energy-efficient conductors. Companies are also expanding their product offerings to cater to specific industry needs, such as smart grids and renewable energy integration. Strategic partnerships, mergers, and acquisitions are common as companies aim to strengthen their market presence and diversify their product portfolios. As demand for advanced conductor solutions grows, companies that can offer high-quality, sustainable, and cost-effective products will maintain a competitive edge in the market.
Recent Developments:
- In November 2024, Prysmian Group introduced a new range of gap conductors designed for high-voltage applications in remote areas.
- In October 2024, General Cable Corporation announced the expansion of its aerial gap conductor product line for use in rail network power supply systems.
- In September 2024, Nexans S.A. launched an advanced gap conductor system for smart grid integration, enhancing energy distribution efficiency.
- In August 2024, Southwire Company, LLC developed a new aluminum alloy conductor for energy storage systems, aimed at improving efficiency and reducing costs.
- In July 2024, Furukawa Electric Co., Ltd. secured a contract to provide gap conductors for a large-scale power transmission project in Asia.
List of Leading Companies:
- Prysmian Group
- General Cable Corporation
- Nexans S.A.
- Southwire Company, LLC
- Furukawa Electric Co., Ltd.
- Sumitomo Electric Industries
- Sterlite Technologies Limited
- TPC Wire & Cable Corp.
- Keystone Cable, Inc.
- LS Cable & System Ltd.
- Bahra Cables Company Ltd.
- Polycab India Limited
- Cable Corporation of India Ltd.
- Hengtong Optic-Electric Co., Ltd.
- J-Power Systems Corporation
Report Scope:
|
Report Features |
Description |
|
Market Size (2023) |
USD 1.0 billion |
|
Forecasted Value (2030) |
USD 1.5 billion |
|
CAGR (2024 – 2030) |
5.2% |
|
Base Year for Estimation |
2023 |
|
Historic Year |
2022 |
|
Forecast Period |
2024 – 2030 |
|
Report Coverage |
Market Forecast, Market Dynamics, Competitive Landscape, Recent Developments |
|
Segments Covered |
Gap Conductor Market By Type (Aerial Gap Conductors, Underground Gap Conductors), By Conductor Material (Copper, Aluminum, Aluminum Alloy), By Voltage Type (High Voltage, Medium Voltage, Low Voltage), By Application (Power Lines, Communication Lines, Energy Storage Systems, Rail Network Power Supply, Smart Grids), By End-Use (Power Transmission, Railways, Telecommunications, Renewable Energy Systems, Industrial Applications) |
|
Regional Analysis |
North America (US, Canada, Mexico), Europe (Germany, France, UK, Italy, Spain, and Rest of Europe), Asia-Pacific (China, Japan, South Korea, Australia, India, and Rest of Asia-Pacific), Latin America (Brazil, Argentina, and Rest of Latin America), Middle East & Africa (Saudi Arabia, UAE, Rest of Middle East & Africa) |
|
Major Companies |
Prysmian Group, General Cable Corporation, Nexans S.A., Southwire Company, LLC, Furukawa Electric Co., Ltd., Sumitomo Electric Industries, Sterlite Technologies Limited, TPC Wire & Cable Corp., Keystone Cable, Inc., LS Cable & System Ltd., Bahra Cables Company Ltd., Polycab India Limited, Cable Corporation of India Ltd., Hengtong Optic-Electric Co., Ltd., J-Power Systems Corporation |
|
Customization Scope |
Customization for segments, region/country-level will be provided. Moreover, additional customization can be done based on the requirements |
|
1. Introduction |
|
1.1. Market Definition |
|
1.2. Scope of the Study |
|
1.3. Research Assumptions |
|
1.4. Study Limitations |
|
2. Research Methodology |
|
2.1. Research Approach |
|
2.1.1. Top-Down Method |
|
2.1.2. Bottom-Up Method |
|
2.1.3. Factor Impact Analysis |
|
2.2. Insights & Data Collection Process |
|
2.2.1. Secondary Research |
|
2.2.2. Primary Research |
|
2.3. Data Mining Process |
|
2.3.1. Data Analysis |
|
2.3.2. Data Validation and Revalidation |
|
2.3.3. Data Triangulation |
|
3. Executive Summary |
|
3.1. Major Markets & Segments |
|
3.2. Highest Growing Regions and Respective Countries |
|
3.3. Impact of Growth Drivers & Inhibitors |
|
3.4. Regulatory Overview by Country |
|
4. Gap Conductor Market, by Type (Market Size & Forecast: USD Million, 2022 – 2030) |
|
4.1. Aerial Gap Conductors |
|
4.2. Underground Gap Conductors |
|
5. Gap Conductor Market, by Conductor Material (Market Size & Forecast: USD Million, 2022 – 2030) |
|
5.1. Copper |
|
5.2. Aluminum |
|
5.3. Aluminum Alloy |
|
5.4. Others |
|
6. Gap Conductor Market, by Voltage Type (Market Size & Forecast: USD Million, 2022 – 2030) |
|
6.1. High Voltage |
|
6.2. Medium Voltage |
|
6.3. Low Voltage |
|
7. Gap Conductor Market, by Application (Market Size & Forecast: USD Million, 2022 – 2030) |
|
7.1. Power Lines |
|
7.2. Communication Lines |
|
7.3. Energy Storage Systems |
|
7.4. Rail Network Power Supply |
|
7.5. Smart Grids |
|
8. Gap Conductor Market, by End-Use (Market Size & Forecast: USD Million, 2022 – 2030) |
|
8.1. Power Transmission |
|
8.2. Railways |
|
8.3. Telecommunications |
|
8.4. Renewable Energy Systems |
|
8.5. Industrial Applications |
|
9. Regional Analysis (Market Size & Forecast: USD Million, 2022 – 2030) |
|
9.1. Regional Overview |
|
9.2. North America |
|
9.2.1. Regional Trends & Growth Drivers |
|
9.2.2. Barriers & Challenges |
|
9.2.3. Opportunities |
|
9.2.4. Factor Impact Analysis |
|
9.2.5. Technology Trends |
|
9.2.6. North America Gap Conductor Market, by Type |
|
9.2.7. North America Gap Conductor Market, by Conductor Material |
|
9.2.8. North America Gap Conductor Market, by Voltage Type |
|
9.2.9. North America Gap Conductor Market, by Application |
|
9.2.10. By Country |
|
9.2.10.1. US |
|
9.2.10.1.1. US Gap Conductor Market, by Type |
|
9.2.10.1.2. US Gap Conductor Market, by Conductor Material |
|
9.2.10.1.3. US Gap Conductor Market, by Voltage Type |
|
9.2.10.1.4. US Gap Conductor Market, by Application |
|
9.2.10.2. Canada |
|
9.2.10.3. Mexico |
|
*Similar segmentation will be provided for each region and country |
|
9.3. Europe |
|
9.4. Asia-Pacific |
|
9.5. Latin America |
|
9.6. Middle East & Africa |
|
10. Competitive Landscape |
|
10.1. Overview of the Key Players |
|
10.2. Competitive Ecosystem |
|
10.2.1. Level of Fragmentation |
|
10.2.2. Market Consolidation |
|
10.2.3. Product Innovation |
|
10.3. Company Share Analysis |
|
10.4. Company Benchmarking Matrix |
|
10.4.1. Strategic Overview |
|
10.4.2. Product Innovations |
|
10.5. Start-up Ecosystem |
|
10.6. Strategic Competitive Insights/ Customer Imperatives |
|
10.7. ESG Matrix/ Sustainability Matrix |
|
10.8. Manufacturing Network |
|
10.8.1. Locations |
|
10.8.2. Supply Chain and Logistics |
|
10.8.3. Product Flexibility/Customization |
|
10.8.4. Digital Transformation and Connectivity |
|
10.8.5. Environmental and Regulatory Compliance |
|
10.9. Technology Readiness Level Matrix |
|
10.10. Technology Maturity Curve |
|
10.11. Buying Criteria |
|
11. Company Profiles |
|
11.1. Prysmian Group |
|
11.1.1. Company Overview |
|
11.1.2. Company Financials |
|
11.1.3. Product/Service Portfolio |
|
11.1.4. Recent Developments |
|
11.1.5. IMR Analysis |
|
*Similar information will be provided for other companies |
|
11.2. General Cable Corporation |
|
11.3. Nexans S.A. |
|
11.4. Southwire Company, LLC |
|
11.5. Furukawa Electric Co., Ltd. |
|
11.6. Sumitomo Electric Industries |
|
11.7. Sterlite Technologies Limited |
|
11.8. TPC Wire & Cable Corp. |
|
11.9. Keystone Cable, Inc. |
|
11.10. LS Cable & System Ltd. |
|
11.11. Bahra Cables Company Ltd. |
|
11.12. Polycab India Limited |
|
11.13. Cable Corporation of India Ltd. |
|
11.14. Hengtong Optic-Electric Co., Ltd. |
|
11.15. J-Power Systems Corporation |
|
12. Appendix |
A comprehensive market research approach was employed to gather and analyze data on the Gap Conductor Market. In the process, the analysis was also done to analyze the parent market and relevant adjacencies to measure the impact of them on the Gap Conductor Market. The research methodology encompassed both secondary and primary research techniques, ensuring the accuracy and credibility of the findings.
.jpg)
Secondary Research
Secondary research involved a thorough review of pertinent industry reports, journals, articles, and publications. Additionally, annual reports, press releases, and investor presentations of industry players were scrutinized to gain insights into their market positioning and strategies.
Primary Research
Primary research involved conducting in-depth interviews with industry experts, stakeholders, and market participants across the E-Waste Management ecosystem. The primary research objectives included:
- Validating findings and assumptions derived from secondary research
- Gathering qualitative and quantitative data on market trends, drivers, and challenges
- Understanding the demand-side dynamics, encompassing end-users, component manufacturers, facility providers, and service providers
- Assessing the supply-side landscape, including technological advancements and recent developments
Market Size Assessment
A combination of top-down and bottom-up approaches was utilized to analyze the overall size of the Gap Conductor Market. These methods were also employed to assess the size of various subsegments within the market. The market size assessment methodology encompassed the following steps:
- Identification of key industry players and relevant revenues through extensive secondary research
- Determination of the industry's supply chain and market size, in terms of value, through primary and secondary research processes
- Calculation of percentage shares, splits, and breakdowns using secondary sources and verification through primary sources
.jpg)
Data Triangulation
To ensure the accuracy and reliability of the market size, data triangulation was implemented. This involved cross-referencing data from various sources, including demand and supply side factors, market trends, and expert opinions. Additionally, top-down and bottom-up approaches were employed to validate the market size assessment.
NA