As per Intent Market Research, the Environmental Sensors Market was valued at USD 1.7 billion in 2023 and will surpass USD 3.5 billion by 2030; growing at a CAGR of 11.1% during 2024 - 2030.
The environmental sensors market is rapidly expanding as a response to increasing environmental concerns and technological advancements. These sensors are integral to monitoring environmental parameters such as air quality, gas levels, temperature, humidity, and pressure across various industries. As urbanization grows and regulatory standards for environmental protection tighten, the demand for real-time data to manage pollution, safety, and sustainability is surging. The integration of environmental sensors into industries like manufacturing, automotive, and healthcare, as well as government initiatives to improve environmental monitoring, is driving the market forward.
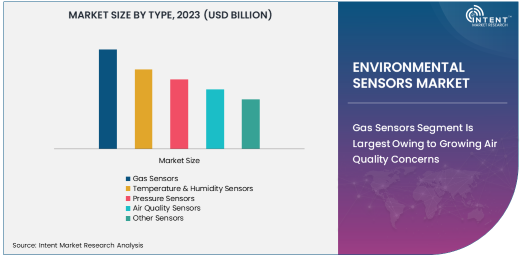
Gas Sensors Segment Is Largest Owing to Growing Air Quality Concerns
Gas sensors dominate the environmental sensors market, driven by heightened concerns over air quality and the increasing need to monitor hazardous gases in both industrial and urban environments. These sensors are pivotal in detecting gases like carbon dioxide (CO2), carbon monoxide (CO), nitrogen dioxide (NO2), and volatile organic compounds (VOCs), contributing to better air quality management, workplace safety, and environmental compliance. The rising global awareness about the harmful effects of pollution and air contamination is a primary factor fueling the demand for gas sensors. Additionally, stringent regulations for air quality standards are propelling the adoption of advanced gas detection solutions.
The market for gas sensors is not only vast but also expanding rapidly, as governments and industries alike are focusing on cleaner air initiatives. For instance, regulatory bodies in regions such as North America and Europe are imposing stringent air quality standards, which significantly increases the demand for these sensors. Furthermore, the adoption of IoT in smart cities and the automotive industry's push toward cleaner emissions further boosts the gas sensors market. The combination of rising environmental concerns and the need for real-time air quality monitoring across various sectors ensures that the gas sensor segment will continue to lead the market.
Industrial Monitoring Application Is Fastest Growing Due to Safety and Efficiency Demands
Among various applications of environmental sensors, industrial monitoring is the fastest growing segment. Industrial operations often pose significant environmental risks, including hazardous emissions and exposure to toxic gases. Environmental sensors used in industrial monitoring help detect gas leaks, air quality imbalances, and temperature variations, providing timely alerts and preventing potential disasters. The need for efficient monitoring systems that enhance worker safety, reduce operational risks, and comply with environmental regulations is driving the rapid adoption of sensors in industries such as manufacturing, chemical processing, and oil & gas.
The industrial monitoring application is also benefiting from the increasing push toward automation and smart factory solutions. As industries move toward more integrated and data-driven operations, environmental sensors are becoming an essential part of the Industrial Internet of Things (IIoT). These sensors provide valuable data that can optimize production efficiency, reduce downtime, and lower costs associated with environmental damage or regulatory non-compliance. This growth is further amplified by the manufacturing sector's expanding footprint in emerging economies, where industrialization is on the rise.
Healthcare End-Use Industry Is Largest Due to Increasing Demand for Patient Safety
In the end-use industry segment, healthcare represents the largest sector for environmental sensors. The demand for healthcare-related environmental sensors is largely driven by the growing need for patient safety and the need to maintain controlled environments in medical facilities. Sensors for monitoring air quality, temperature, humidity, and even gas levels in hospitals and clinics are vital for ensuring the health and well-being of both patients and medical staff. Additionally, healthcare regulations worldwide increasingly require monitoring of environmental parameters to meet infection control standards, which further elevates the role of these sensors in the sector.
The healthcare industry’s reliance on environmental sensors has also been amplified by the global health crisis, such as the COVID-19 pandemic, which highlighted the need for improved indoor air quality and contamination control. Sensors that monitor airflow, particulate matter, and ventilation systems are becoming more integrated into healthcare facilities as they strive to create safer environments for patients and healthcare workers. As the sector continues to grow, particularly with the rise of medical innovations and healthcare infrastructure in developing regions, environmental sensors will remain a key enabler of safety and efficiency in the healthcare sector.
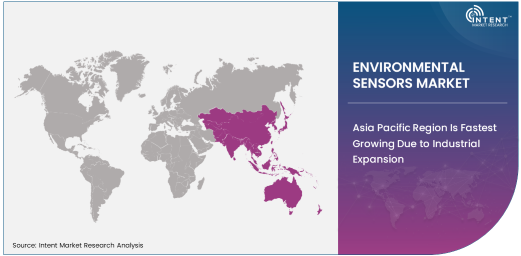
Asia Pacific Region Is Fastest Growing Due to Industrial Expansion
Asia Pacific is the fastest growing region in the environmental sensors market, driven by rapid industrialization, urbanization, and government initiatives focused on environmental sustainability. Countries like China, India, and Japan are increasingly adopting environmental sensors to monitor and manage pollution levels, air quality, and industrial emissions. With industrial expansion in this region, the demand for real-time monitoring solutions for air quality, gas leaks, and other environmental factors is booming. Moreover, governments in the region are implementing stringent environmental regulations to curb pollution, creating a large market for gas and air quality sensors.
Asia Pacific’s rapid urbanization is also contributing to the rising adoption of environmental sensors. As cities grow, air pollution becomes a pressing concern, driving the need for better monitoring solutions. Additionally, industries such as automotive, oil & gas, and manufacturing, which are expanding rapidly in this region, require environmental sensors to ensure compliance with both local and international regulations. This combination of industrial growth and regulatory pressure positions Asia Pacific as the fastest growing region in the environmental sensors market.
Leading Companies and Competitive Landscape
The environmental sensors market is highly competitive, with several global players leading the market through innovations in sensor technologies and strategic partnerships. Companies like Honeywell International, Bosch Sensortec, Siemens AG, and Emerson Electric are at the forefront, offering a range of advanced environmental sensors for various applications. These companies are increasingly investing in research and development to enhance the accuracy, reliability, and functionality of their sensors, particularly in the areas of air quality monitoring and gas detection.
The competitive landscape is also shaped by collaborations, acquisitions, and partnerships aimed at expanding product portfolios and regional reach. For example, many companies are joining forces with IoT solution providers to integrate environmental sensors with smart city infrastructure. The trend towards miniaturization of sensors and the development of wireless sensing technologies are also key focus areas for these leading players, as they aim to meet the growing demand for cost-effective, easy-to-integrate monitoring solutions. As the market continues to grow, companies that can offer scalable, high-performance sensors with real-time capabilities will maintain a competitive edge.
Recent Developments:
- Honeywell launched an advanced smart gas sensor designed to monitor air quality and hazardous gases, aiming to improve safety and efficiency in industrial applications.
- Bosch Sensortec unveiled new technology for air quality sensors, leveraging MEMS technology to provide real-time pollution detection, contributing to better urban air quality management.
- Siemens announced a strategic partnership with several startups to enhance its smart environmental sensor offerings, focusing on IoT and AI integration for smart cities.
- Emerson Electric Co. completed the acquisition of a leading environmental sensor technology firm, expanding its portfolio of sensors for industrial and environmental monitoring applications.
- STMicroelectronics received regulatory approval for its newly developed air quality sensor, designed to support health and safety in urban environments by monitoring indoor air conditions.
List of Leading Companies:
- Honeywell International Inc.
- Bosch Sensortec GmbH
- Siemens AG
- TE Connectivity Ltd.
- Emerson Electric Co.
- Amphenol Corporation
- General Electric Company
- ABB Ltd.
- STMicroelectronics N.V.
- Texas Instruments Incorporated
- Sensirion AG
- Figaro Engineering Inc.
- Aeroqual Ltd.
- Yokogawa Electric Corporation
- Schauenburg Systems GmbH
Report Scope:
|
Report Features |
Description |
|
Market Size (2023) |
USD 1.7 Billion |
|
Forecasted Value (2030) |
USD 3.5 Billion |
|
CAGR (2024 – 2030) |
11.1% |
|
Base Year for Estimation |
2023 |
|
Historic Year |
2022 |
|
Forecast Period |
2024 – 2030 |
|
Report Coverage |
Market Forecast, Market Dynamics, Competitive Landscape, Recent Developments |
|
Segments Covered |
Environmental Sensors Market By Type (Gas Sensors, Temperature & Humidity Sensors, Pressure Sensors, Air Quality Sensors), By Application (Industrial Monitoring, Environmental Monitoring, Automotive, Healthcare, Agriculture), By End-Use Industry (Manufacturing, Oil & Gas, Healthcare, Automotive, Agriculture) |
|
Regional Analysis |
North America (US, Canada, Mexico), Europe (Germany, France, UK, Italy, Spain, and Rest of Europe), Asia-Pacific (China, Japan, South Korea, Australia, India, and Rest of Asia-Pacific), Latin America (Brazil, Argentina, and Rest of Latin America), Middle East & Africa (Saudi Arabia, UAE, Rest of Middle East & Africa) |
|
Major Companies |
Honeywell International Inc., Bosch Sensortec GmbH, Siemens AG, TE Connectivity Ltd., Emerson Electric Co., Amphenol Corporation, General Electric Company, ABB Ltd., STMicroelectronics N.V., Texas Instruments Incorporated, Sensirion AG, Figaro Engineering Inc., Aeroqual Ltd., Yokogawa Electric Corporation, Schauenburg Systems GmbH |
|
Customization Scope |
Customization for segments, region/country-level will be provided. Moreover, additional customization can be done based on the requirements |
|
1. Introduction |
|
1.1. Market Definition |
|
1.2. Scope of the Study |
|
1.3. Research Assumptions |
|
1.4. Study Limitations |
|
2. Research Methodology |
|
2.1. Research Approach |
|
2.1.1. Top-Down Method |
|
2.1.2. Bottom-Up Method |
|
2.1.3. Factor Impact Analysis |
|
2.2. Insights & Data Collection Process |
|
2.2.1. Secondary Research |
|
2.2.2. Primary Research |
|
2.3. Data Mining Process |
|
2.3.1. Data Analysis |
|
2.3.2. Data Validation and Revalidation |
|
2.3.3. Data Triangulation |
|
3. Executive Summary |
|
3.1. Major Markets & Segments |
|
3.2. Highest Growing Regions and Respective Countries |
|
3.3. Impact of Growth Drivers & Inhibitors |
|
3.4. Regulatory Overview by Country |
|
4. Environmental Remediation Services Market, by Type (Market Size & Forecast: USD Million, 2022 – 2030) |
|
4.1. Gas Sensors |
|
4.2. Temperature & Humidity Sensors |
|
4.3. Pressure Sensors |
|
4.4. Air Quality Sensors |
|
4.5. Other Sensors |
|
5. Environmental Remediation Services Market, by Application (Market Size & Forecast: USD Million, 2022 – 2030) |
|
5.1. Industrial Monitoring |
|
5.2. Environmental Monitoring |
|
5.3. Automotive |
|
5.4. Healthcare |
|
5.5. Agriculture |
|
5.6. Consumer Electronics |
|
6. Environmental Remediation Services Market, by End-Use Industry (Market Size & Forecast: USD Million, 2022 – 2030) |
|
6.1. Manufacturing |
|
6.2. Oil & Gas |
|
6.3. Healthcare |
|
6.4. Automotive |
|
6.5. Agriculture |
|
6.6. Government |
|
6.7. Residential |
|
7. Regional Analysis (Market Size & Forecast: USD Million, 2022 – 2030) |
|
7.1. Regional Overview |
|
7.2. North America |
|
7.2.1. Regional Trends & Growth Drivers |
|
7.2.2. Barriers & Challenges |
|
7.2.3. Opportunities |
|
7.2.4. Factor Impact Analysis |
|
7.2.5. Technology Trends |
|
7.2.6. North America Environmental Remediation Services Market, by Type |
|
7.2.7. North America Environmental Remediation Services Market, by Application |
|
7.2.8. North America Environmental Remediation Services Market, by End-Use Industry |
|
7.2.9. By Country |
|
7.2.9.1. US |
|
7.2.9.1.1. US Environmental Remediation Services Market, by Type |
|
7.2.9.1.2. US Environmental Remediation Services Market, by Application |
|
7.2.9.1.3. US Environmental Remediation Services Market, by End-Use Industry |
|
7.2.9.2. Canada |
|
7.2.9.3. Mexico |
|
*Similar segmentation will be provided for each region and country |
|
7.3. Europe |
|
7.4. Asia-Pacific |
|
7.5. Latin America |
|
7.6. Middle East & Africa |
|
8. Competitive Landscape |
|
8.1. Overview of the Key Players |
|
8.2. Competitive Ecosystem |
|
8.2.1. Level of Fragmentation |
|
8.2.2. Market Consolidation |
|
8.2.3. Product Innovation |
|
8.3. Company Share Analysis |
|
8.4. Company Benchmarking Matrix |
|
8.4.1. Strategic Overview |
|
8.4.2. Product Innovations |
|
8.5. Start-up Ecosystem |
|
8.6. Strategic Competitive Insights/ Customer Imperatives |
|
8.7. ESG Matrix/ Sustainability Matrix |
|
8.8. Manufacturing Network |
|
8.8.1. Locations |
|
8.8.2. Supply Chain and Logistics |
|
8.8.3. Product Flexibility/Customization |
|
8.8.4. Digital Transformation and Connectivity |
|
8.8.5. Environmental and Regulatory Compliance |
|
8.9. Technology Readiness Level Matrix |
|
8.10. Technology Maturity Curve |
|
8.11. Buying Criteria |
|
9. Company Profiles |
|
9.1. Honeywell International Inc. |
|
9.1.1. Company Overview |
|
9.1.2. Company Financials |
|
9.1.3. Product/Service Portfolio |
|
9.1.4. Recent Developments |
|
9.1.5. IMR Analysis |
|
*Similar information will be provided for other companies |
|
9.2. Bosch Sensortec GmbH |
|
9.3. Siemens AG |
|
9.4. TE Connectivity Ltd. |
|
9.5. Emerson Electric Co. |
|
9.6. Amphenol Corporation |
|
9.7. General Electric Company |
|
9.8. ABB Ltd. |
|
9.9. STMicroelectronics N.V. |
|
9.10. Texas Instruments Incorporated |
|
9.11. Sensirion AG |
|
9.12. Figaro Engineering Inc. |
|
9.13. Aeroqual Ltd. |
|
9.14. Yokogawa Electric Corporation |
|
9.15. Schauenburg Systems GmbH |
|
10. Appendix |
A comprehensive market research approach was employed to gather and analyze data on the Environmental Sensors Market. In the process, the analysis was also done to analyze the parent market and relevant adjacencies to measure the impact of them on the Environmental Sensors Market. The research methodoloagy encompassed both secondary and primary research techniques, ensuring the accuracy and credibility of the findings.
.jpg)
Secondary Research
Secondary research involved a thorough review of pertinent industry reports, journals, articles, and publications. Additionally, annual reports, press releases, and investor presentations of industry players were scrutinized to gain insights into their market positioning and strategies.
Primary Research
Primary research involved conducting in-depth interviews with industry experts, stakeholders, and market participants across the E-Waste Management ecosystem. The primary research objectives included:
- Validating findings and assumptions derived from secondary research
- Gathering qualitative and quantitative data on market trends, drivers, and challenges
- Understanding the demand-side dynamics, encompassing end-users, component manufacturers, facility providers, and service providers
- Assessing the supply-side landscape, including technological advancements and recent developments
Market Size Assessment
A combination of top-down and bottom-up approaches was utilized to analyze the overall size of the Environmental Sensors Market. These methods were also employed to assess the size of various subsegments within the market. The market size assessment methodology encompassed the following steps:
- Identification of key industry players and relevant revenues through extensive secondary research
- Determination of the industry's supply chain and market size, in terms of value, through primary and secondary research processes
- Calculation of percentage shares, splits, and breakdowns using secondary sources and verification through primary sources
.jpg)
Data Triangulation
To ensure the accuracy and reliability of the market size, data triangulation was implemented. This involved cross-referencing data from various sources, including demand and supply side factors, market trends, and expert opinions. Additionally, top-down and bottom-up approaches were employed to validate the market size assessment.
NA