As per Intent Market Research, the Internet Of Things (IoT) In Chemical Market was valued at USD 78.4 Billion in 2024-e and will surpass USD 170.8 Billion by 2030; growing at a CAGR of 13.9% during 2025-2030.
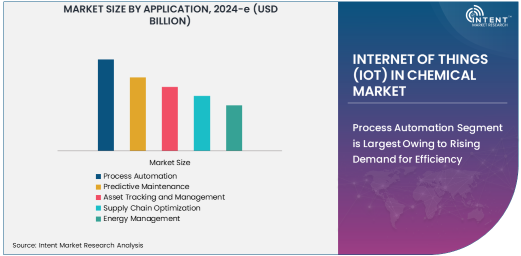
The Internet of Things (IoT) in the chemical industry is revolutionizing traditional operations, enabling companies to leverage real-time data, improve decision-making, and drive automation. Among the various applications of IoT in this sector, Process Automation stands out as the largest segment. This application focuses on automating complex chemical processes, reducing human intervention, and optimizing production lines. By integrating IoT-enabled sensors and devices, chemical manufacturers can monitor systems in real time, ensuring consistent product quality while maximizing output.
Process Automation Segment is Largest Owing to Rising Demand for Efficiency
The demand for process automation is primarily driven by the need for operational efficiency and sustainability. IoT helps in minimizing errors, improving production flexibility, and enhancing safety standards. With the ability to automatically adjust machinery based on real-time data, chemical plants can optimize throughput, reduce energy consumption, and lower operational costs. As industries strive to meet stringent regulations and improve their environmental impact, process automation remains a critical area of focus, securing its position as the largest sub-segment in the market.
Software Segment is Fastest Growing Owing to Digital Transformation
In the IoT ecosystem for chemicals, the Software component is the fastest growing. Software solutions are integral in processing and analyzing the vast amount of data generated by IoT devices. These software solutions include advanced analytics platforms, machine learning models, and cloud-based applications that enable real-time monitoring, predictive analytics, and process optimization. As chemical companies increasingly adopt digital transformation strategies, the demand for sophisticated software solutions is growing rapidly.
The shift toward data-driven decision-making is accelerating software adoption. With the ability to gather, analyze, and visualize data, chemical manufacturers can gain valuable insights into production processes, identify inefficiencies, and predict future trends. This enables proactive decision-making, helping companies stay competitive in an evolving market. As the chemical industry embraces Industry 4.0, the software segment will continue to lead as the fastest-growing sub-segment in the IoT market.
Petrochemical Industry is Largest Contributor to IoT Demand
The Petrochemical Industry represents the largest end-user segment for IoT in the chemical market. Petrochemical companies, which produce chemicals derived from petroleum and natural gas, require precise control over their production processes, from refining crude oil to manufacturing specialized chemicals. IoT technologies, including sensors and automation systems, provide real-time data that can optimize production efficiency, reduce waste, and enhance safety.
Given the scale of petrochemical operations and their complex, high-risk environments, IoT plays a crucial role in ensuring smooth operations. The industry has widely adopted IoT for process optimization, predictive maintenance, and energy management, helping manufacturers cut costs while meeting sustainability goals. As the demand for oil and gas products continues to grow, the petrochemical sector will remain a major driver of the IoT market in the chemical industry.
Cloud-Based IoT Solutions are Dominating the Market
The Cloud-Based IoT Solutions segment is currently dominating the market due to its scalability, cost-efficiency, and flexibility. With cloud-based platforms, chemical companies can store and process large volumes of data without the need for significant on-premise infrastructure. These solutions enable real-time monitoring and data analytics, which is crucial for improving operational efficiency across chemical plants.
Cloud-based systems also offer enhanced security features and flexibility, allowing chemical companies to scale their operations as needed. With the rise of Industry 4.0, cloud-based IoT solutions facilitate seamless communication between devices and systems, creating a connected ecosystem. The ease of integration with existing IT infrastructure further drives the adoption of cloud-based solutions, positioning this segment as the leader in the deployment mode category for IoT in the chemical industry.
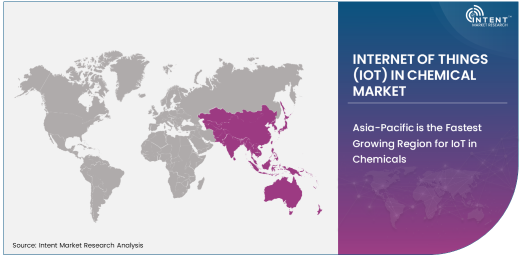
Asia-Pacific is the Fastest Growing Region for IoT in Chemicals
The Asia-Pacific (APAC) region is experiencing the fastest growth in the IoT in the chemical market. Countries like China, Japan, and India are leading the charge, with rapid industrialization and increasing government investments in digitalization. The growth in the chemical industry, particularly in manufacturing, agriculture, and petrochemicals, is driving the demand for IoT solutions. Additionally, the region's efforts to modernize its infrastructure and focus on smart manufacturing are fueling the growth of IoT technologies in this sector.
Asia-Pacific’s diverse chemical industry, coupled with growing technological adoption and increasing awareness of IoT’s benefits, is making it a hotspot for innovation. The region's high adoption of cloud computing, combined with a booming manufacturing sector, positions it as the fastest-growing market for IoT in chemicals. As companies in APAC continue to seek ways to enhance operational efficiencies and meet environmental goals, the adoption of IoT solutions will remain robust in this region.
Competitive Landscape: Leading Companies Driving the IoT in Chemical Market
The competitive landscape of the IoT in the chemical market is highly dynamic, with several global and regional players contributing to the sector's growth. Leading companies such as Siemens AG, Honeywell International, and Schneider Electric are at the forefront, offering a wide range of IoT-enabled solutions for process automation, predictive maintenance, and energy management. These companies combine advanced technologies like artificial intelligence, machine learning, and cloud computing to help chemical manufacturers optimize their operations.
Recent Developments:
- Siemens AG announced the launch of its new IoT-based predictive maintenance solution for industrial applications, enhancing uptime in the chemical sector.
- Honeywell International Inc. acquired a leading IoT technology firm to expand its digital transformation capabilities in the chemical industry.
- Schneider Electric launched a new IoT-enabled energy management platform aimed at improving energy efficiency in chemical manufacturing plants.
- Emerson Electric Co. received regulatory approval for its acquisition of a competitor, enhancing its IoT solutions portfolio for the chemical market.
- Cisco Systems Inc. unveiled a new IoT-enabled networking solution to provide faster, more secure data transmission for chemical plants globally.
List of Leading Companies:
- Siemens AG
- Honeywell International Inc.
- Schneider Electric
- Rockwell Automation
- Emerson Electric Co.
- Cisco Systems Inc.
- GE Digital
- ABB Ltd.
- IBM Corporation
- Microsoft Corporation
- SAP SE
- Intel Corporation
- Oracle Corporation
- Bosch Group
- Qualcomm Technologies Inc.
Report Scope:
|
Report Features |
Description |
|
Market Size (2024-e) |
USD 78.4 Billion |
|
Forecasted Value (2030) |
USD 170.8 Billion |
|
CAGR (2025 – 2030) |
13.9% |
|
Base Year for Estimation |
2024-e |
|
Historic Year |
2023 |
|
Forecast Period |
2025 – 2030 |
|
Report Coverage |
Market Forecast, Market Dynamics, Competitive Landscape, Recent Developments |
|
Segments Covered |
Internet of Things (IoT) in Chemical Market By Application (Process Automation, Predictive Maintenance, Asset Tracking and Management, Supply Chain Optimization, Energy Management), By Component (Hardware, Software, Services), By End-User Industry (Petrochemical, Pharmaceuticals, Agriculture, Food & Beverage, Specialty Chemicals), By Deployment Mode (Cloud-Based IoT Solutions, On-Premise IoT Solutions) |
|
Regional Analysis |
North America (US, Canada, Mexico), Europe (Germany, France, UK, Italy, Spain, and Rest of Europe), Asia-Pacific (China, Japan, South Korea, Australia, India, and Rest of Asia-Pacific), Latin America (Brazil, Argentina, and Rest of Latin America), Middle East & Africa (Saudi Arabia, UAE, Rest of Middle East & Africa) |
|
Major Companies |
Smart Factory, Industrial IoT, Connected Devices, Automation, Real-time Data, Predictive Analytics, Sensors, Cloud Computing, Digital Transformation, Wireless Communication, Data Integration, Supply Chain Management, Remote Monitoring, Process Optimization, Machine Learning |
|
Customization Scope |
Customization for segments, region/country-level will be provided. Moreover, additional customization can be done based on the requirements |
|
1. Introduction |
|
1.1. Market Definition |
|
1.2. Scope of the Study |
|
1.3. Research Assumptions |
|
1.4. Study Limitations |
|
2. Research Methodology |
|
2.1. Research Approach |
|
2.1.1. Top-Down Method |
|
2.1.2. Bottom-Up Method |
|
2.1.3. Factor Impact Analysis |
|
2.2. Insights & Data Collection Process |
|
2.2.1. Secondary Research |
|
2.2.2. Primary Research |
|
2.3. Data Mining Process |
|
2.3.1. Data Analysis |
|
2.3.2. Data Validation and Revalidation |
|
2.3.3. Data Triangulation |
|
3. Executive Summary |
|
3.1. Major Markets & Segments |
|
3.2. Highest Growing Regions and Respective Countries |
|
3.3. Impact of Growth Drivers & Inhibitors |
|
3.4. Regulatory Overview by Country |
|
4. Internet Of Things (IoT) In Chemical Market, by Application (Market Size & Forecast: USD Million, 2023 – 2030) |
|
4.1. Process Automation |
|
4.2. Predictive Maintenance |
|
4.3. Asset Tracking and Management |
|
4.4. Supply Chain Optimization |
|
4.5. Energy Management |
|
5. Internet Of Things (IoT) In Chemical Market, by Component (Market Size & Forecast: USD Million, 2023 – 2030) |
|
5.1. Hardware |
|
5.2. Software |
|
5.3. Services |
|
6. Internet Of Things (IoT) In Chemical Market, by End-User Industry (Market Size & Forecast: USD Million, 2023 – 2030) |
|
6.1. Petrochemical |
|
6.2. Pharmaceuticals |
|
6.3. Agriculture |
|
6.4. Food & Beverage |
|
6.5. Specialty Chemicals |
|
7. Internet Of Things (IoT) In Chemical Market, by Deployment Mode (Market Size & Forecast: USD Million, 2023 – 2030) |
|
7.1. Cloud-Based IoT Solutions |
|
7.2. On-Premise IoT Solutions |
|
8. Regional Analysis (Market Size & Forecast: USD Million, 2023 – 2030) |
|
8.1. Regional Overview |
|
8.2. North America |
|
8.2.1. Regional Trends & Growth Drivers |
|
8.2.2. Barriers & Challenges |
|
8.2.3. Opportunities |
|
8.2.4. Factor Impact Analysis |
|
8.2.5. Technology Trends |
|
8.2.6. North America Internet Of Things (IoT) In Chemical Market, by Application |
|
8.2.7. North America Internet Of Things (IoT) In Chemical Market, by Component |
|
8.2.8. North America Internet Of Things (IoT) In Chemical Market, by End-User Industry |
|
8.2.9. North America Internet Of Things (IoT) In Chemical Market, by Deployment Mode |
|
8.2.10. By Country |
|
8.2.10.1. US |
|
8.2.10.1.1. US Internet Of Things (IoT) In Chemical Market, by Application |
|
8.2.10.1.2. US Internet Of Things (IoT) In Chemical Market, by Component |
|
8.2.10.1.3. US Internet Of Things (IoT) In Chemical Market, by End-User Industry |
|
8.2.10.1.4. US Internet Of Things (IoT) In Chemical Market, by Deployment Mode |
|
8.2.10.2. Canada |
|
8.2.10.3. Mexico |
|
*Similar segmentation will be provided for each region and country |
|
8.3. Europe |
|
8.4. Asia-Pacific |
|
8.5. Latin America |
|
8.6. Middle East & Africa |
|
9. Competitive Landscape |
|
9.1. Overview of the Key Players |
|
9.2. Competitive Ecosystem |
|
9.2.1. Level of Fragmentation |
|
9.2.2. Market Consolidation |
|
9.2.3. Product Innovation |
|
9.3. Company Share Analysis |
|
9.4. Company Benchmarking Matrix |
|
9.4.1. Strategic Overview |
|
9.4.2. Product Innovations |
|
9.5. Start-up Ecosystem |
|
9.6. Strategic Competitive Insights/ Customer Imperatives |
|
9.7. ESG Matrix/ Sustainability Matrix |
|
9.8. Manufacturing Network |
|
9.8.1. Locations |
|
9.8.2. Supply Chain and Logistics |
|
9.8.3. Product Flexibility/Customization |
|
9.8.4. Digital Transformation and Connectivity |
|
9.8.5. Environmental and Regulatory Compliance |
|
9.9. Technology Readiness Level Matrix |
|
9.10. Technology Maturity Curve |
|
9.11. Buying Criteria |
|
10. Company Profiles |
|
10.1. Siemens AG |
|
10.1.1. Company Overview |
|
10.1.2. Company Financials |
|
10.1.3. Product/Service Portfolio |
|
10.1.4. Recent Developments |
|
10.1.5. IMR Analysis |
|
*Similar information will be provided for other companies |
|
10.2. Honeywell International Inc. |
|
10.3. Schneider Electric |
|
10.4. Rockwell Automation |
|
10.5. Emerson Electric Co. |
|
10.6. Cisco Systems Inc. |
|
10.7. GE Digital |
|
10.8. ABB Ltd. |
|
10.9. IBM Corporation |
|
10.10. Microsoft Corporation |
|
10.11. SAP SE |
|
10.12. Intel Corporation |
|
10.13. Oracle Corporation |
|
10.14. Bosch Group |
|
10.15. Qualcomm Technologies Inc. |
|
11. Appendix |
A comprehensive market research approach was employed to gather and analyze data on the Internet of Things (IoT) in Chemical Market. In the process, the analysis was also done to analyze the parent market and relevant adjacencies to measure the impact of them on the Internet of Things (IoT) in Chemical Market. The research methodology encompassed both secondary and primary research techniques, ensuring the accuracy and credibility of the findings.
.jpg)
Secondary Research
Secondary research involved a thorough review of pertinent industry reports, journals, articles, and publications. Additionally, annual reports, press releases, and investor presentations of industry players were scrutinized to gain insights into their market positioning and strategies.
Primary Research
Primary research involved conducting in-depth interviews with industry experts, stakeholders, and market participants across the E-Waste Management ecosystem. The primary research objectives included:
- Validating findings and assumptions derived from secondary research
- Gathering qualitative and quantitative data on market trends, drivers, and challenges
- Understanding the demand-side dynamics, encompassing end-users, component manufacturers, facility providers, and service providers
- Assessing the supply-side landscape, including technological advancements and recent developments
Market Size Assessment
A combination of top-down and bottom-up approaches was utilized to analyze the overall size of the Internet of Things (IoT) in Chemical Market. These methods were also employed to assess the size of various subsegments within the market. The market size assessment methodology encompassed the following steps:
- Identification of key industry players and relevant revenues through extensive secondary research
- Determination of the industry's supply chain and market size, in terms of value, through primary and secondary research processes
- Calculation of percentage shares, splits, and breakdowns using secondary sources and verification through primary sources
.jpg)
Data Triangulation
To ensure the accuracy and reliability of the market size, data triangulation was implemented. This involved cross-referencing data from various sources, including demand and supply side factors, market trends, and expert opinions. Additionally, top-down and bottom-up approaches were employed to validate the market size assessment.
NA