As per Intent Market Research, the Chemical Hydrogen Generation Market was valued at USD 1.5 billion in 2023 and will surpass USD 4.4 billion by 2030; growing at a CAGR of 17.0% during 2024 - 2030.
The chemical hydrogen generation market is rapidly evolving, driven by the increasing demand for hydrogen as a clean energy source across various industries. Hydrogen is considered a key element in the global transition towards a low-carbon economy, with its applications spanning fuel cells, power generation, oil refining, and industrial hydrogen production. The market for chemical hydrogen generation is experiencing robust growth due to technological advancements and growing environmental concerns. Electrolysis, steam methane reforming (SMR), and other methods are widely used for hydrogen production, with demand intensifying due to hydrogen's potential in decarbonizing sectors like transportation and energy.
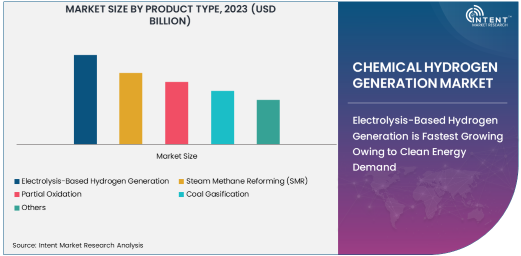
Electrolysis-Based Hydrogen Generation is Fastest Growing Owing to Clean Energy Demand
Among the various hydrogen generation technologies, electrolysis-based hydrogen production is the fastest growing, particularly driven by the global shift towards clean energy. Electrolysis involves using electricity to split water molecules into hydrogen and oxygen, a process that can be fully powered by renewable energy sources, making it a critical method for producing green hydrogen. As governments and industries push for decarbonization, electrolysis technology has gained considerable traction. The ability to produce hydrogen without emitting carbon dioxide makes it an attractive option in industries focused on sustainability.
One of the key advantages of electrolysis is its scalability and adaptability to renewable energy integration. As renewable energy capacity grows, especially solar and wind, the potential for hydrogen production through electrolysis becomes more viable. Countries like Germany and the Netherlands are already leading the way in scaling up electrolysis technologies, which is expected to continue driving growth in this segment. This aligns with global sustainability goals and positions electrolysis as a central technology in the hydrogen economy.
Oil & Gas Industry is the Largest End-User for Chemical Hydrogen Generation
The oil & gas industry remains the largest end-user of chemical hydrogen generation. Hydrogen plays a pivotal role in refining processes, where it is used to produce cleaner fuels through processes such as hydrocracking and desulfurization. The ongoing demand for cleaner fuels and the reduction of sulfur emissions from oil products ensures that hydrogen remains essential to this sector. Furthermore, hydrogen is integral to various upstream oil and gas processes, including enhanced oil recovery and the reduction of carbon emissions during production.
The need for hydrogen in the oil and gas industry is poised to grow further as companies move towards decarbonizing their operations. Efforts to reduce carbon footprints, combined with advancements in hydrogen production technologies like steam methane reforming (SMR), ensure that the oil and gas industry will continue to be a dominant consumer of hydrogen. The sector's large scale, combined with its reliance on hydrogen for refining operations, ensures that it will remain at the forefront of chemical hydrogen generation applications.
Proton Exchange Membrane (PEM) Electrolysis is Fastest Growing Technology
In terms of technology, Proton Exchange Membrane (PEM) electrolysis is the fastest-growing technology in the chemical hydrogen generation market. PEM electrolysis offers high efficiency and flexibility, with the ability to operate at variable power inputs from renewable sources. Unlike alkaline electrolysis, which is most effective at a constant output, PEM electrolyzers are capable of responding to fluctuating renewable energy sources, making them ideal for integration with wind and solar power. This technology's rapid growth is largely driven by the increasing demand for decentralized and flexible hydrogen production systems.
PEM electrolysis also offers the advantage of producing high-purity hydrogen, making it particularly valuable for applications requiring high-quality hydrogen, such as fuel cell vehicles. The cost of PEM electrolyzers has decreased in recent years due to technological advances and increased production volumes, contributing to the broader adoption of this technology. As a result, PEM electrolysis is becoming a key component of national and international hydrogen strategies, ensuring its continued growth in the coming years.
Industrial Hydrogen Production is the Largest Application for Chemical Hydrogen Generation
Industrial hydrogen production is the largest application in the chemical hydrogen generation market. Hydrogen is crucial for various industrial processes, such as ammonia production for fertilizers, methanol production, and petroleum refining. In the industrial sector, hydrogen is used in chemical processes like hydrotreating, hydrocracking, and hydrogenation. The robust demand for hydrogen in the chemical and petrochemical industries is driving this segment’s growth. Furthermore, the trend towards replacing traditional feedstocks with hydrogen in chemical manufacturing processes is accelerating, expanding its adoption.
The increasing focus on green and sustainable hydrogen production methods, particularly through electrolysis, is driving growth in this sector. Governments worldwide are pushing for cleaner industrial processes, which is expected to sustain the demand for industrial hydrogen. Additionally, the expansion of industries like food and beverage, where hydrogen is used for hydrogenation and other applications, will further fuel the market's growth.
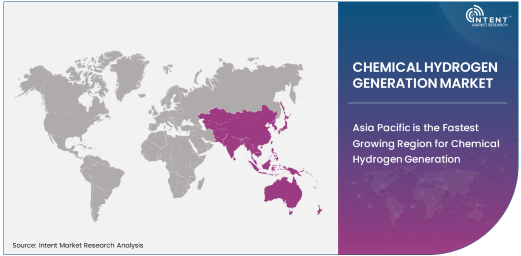
Asia Pacific is the Fastest Growing Region for Chemical Hydrogen Generation
Asia Pacific is the fastest-growing region in the chemical hydrogen generation market, driven by the high demand for hydrogen in industries such as oil and gas, chemicals, and energy. Countries like China, Japan, and South Korea are making significant investments in hydrogen infrastructure as part of their strategies to reduce carbon emissions. China, in particular, is expected to drive the majority of the region’s growth, with its ambitious goals to become a global leader in hydrogen production and utilization.
The rapid industrialization in emerging markets, along with substantial government support for clean energy initiatives, has made Asia Pacific a key player in the global hydrogen generation market. With large-scale hydrogen production facilities being planned and built in this region, it is expected to remain the fastest-growing market for chemical hydrogen generation technologies. The region's focus on hydrogen as part of its renewable energy and decarbonization strategies ensures robust market growth.
Leading Companies and Competitive Landscape
The competitive landscape in the chemical hydrogen generation market is characterized by the presence of several key players with diverse technological expertise. Leading companies like Air Liquide, Linde Group, Plug Power, ITM Power, and Siemens Energy are driving innovations in hydrogen production technologies, including electrolysis, steam methane reforming (SMR), and advanced fuel cell technologies. These companies are investing heavily in R&D to improve the efficiency, scalability, and cost-effectiveness of hydrogen generation processes.
Collaboration and partnerships are key strategies adopted by companies to expand their market reach. For instance, Siemens Energy has formed strategic alliances with technology providers and governments to scale up hydrogen production and infrastructure. Companies are also increasingly focusing on integrating renewable energy with hydrogen production to meet sustainability goals, which is positioning them to lead the market in the coming years. The rising demand for hydrogen in clean energy applications, coupled with government support for low-carbon technologies, ensures intense competition and innovation within the market.
Recent Developments:
- Air Products and Chemicals launched a new hydrogen production facility in the U.S. to expand its hydrogen infrastructure in the region.
- ITM Power announced a collaboration with Siemens Energy to scale up their electrolyzer production capacity for green hydrogen production.
- Plug Power Inc. entered into a strategic partnership with Renault to develop hydrogen-powered fuel cells for transportation and commercial applications.
- Nel ASA received regulatory approval for a new hydrogen production plant in Norway, aimed at boosting its green hydrogen supply to industrial clients.
- Hydrogenics (now part of Cummins Inc.) was awarded a major contract for supplying electrolyzers to a large-scale renewable hydrogen production facility in Europe.
List of Leading Companies:
- Air Liquide
- Linde Group
- Iwatani Corporation
- Hydrogenics (Cummins Inc.)
- ITM Power
- Ballard Power Systems
- Plug Power Inc.
- Siemens Energy
- Praxair Inc. (Linde Group)
- Air Products and Chemicals, Inc.
- Toshiba Energy Systems & Solutions Corporation
- Nel ASA
- Hyundai Motor Group
- Shell Global Solutions
- McPhy Energy
Report Scope:
|
Report Features |
Description |
|
Market Size (2023) |
USD 1.5 Billion |
|
Forecasted Value (2030) |
USD 4.4 Billion |
|
CAGR (2024 – 2030) |
17.0% |
|
Base Year for Estimation |
2023 |
|
Historic Year |
2022 |
|
Forecast Period |
2024 – 2030 |
|
Report Coverage |
Market Forecast, Market Dynamics, Competitive Landscape, Recent Developments |
|
Segments Covered |
Chemical Hydrogen Generation Market By Product Type (Electrolysis-Based Hydrogen Generation, Steam Methane Reforming (SMR), Partial Oxidation, Coal Gasification), By End-User Industry (Oil & Gas, Chemicals & Fertilizers, Food & Beverage, Metals & Mining, Energy & Power), By Technology (Proton Exchange Membrane (PEM) Electrolysis, Alkaline Electrolysis, Solid Oxide Electrolysis, High-Temperature Gas Electrolysis), By Application (Industrial Hydrogen Production, Fuel Cells, Oil Refining, Power Generation) |
|
Regional Analysis |
North America (US, Canada, Mexico), Europe (Germany, France, UK, Italy, Spain, and Rest of Europe), Asia-Pacific (China, Japan, South Korea, Australia, India, and Rest of Asia-Pacific), Latin America (Brazil, Argentina, and Rest of Latin America), Middle East & Africa (Saudi Arabia, UAE, Rest of Middle East & Africa) |
|
Major Companies |
Air Liquide, Linde Group, Iwatani Corporation, Hydrogenics (Cummins Inc.), ITM Power, Ballard Power Systems, Plug Power Inc., Siemens Energy, Praxair Inc. (Linde Group), Air Products and Chemicals, Inc., Toshiba Energy Systems & Solutions Corporation, Nel ASA, Hyundai Motor Group, Shell Global Solutions, McPhy Energy |
|
Customization Scope |
Customization for segments, region/country-level will be provided. Moreover, additional customization can be done based on the requirements |
|
1. Introduction |
|
1.1. Market Definition |
|
1.2. Scope of the Study |
|
1.3. Research Assumptions |
|
1.4. Study Limitations |
|
2. Research Methodology |
|
2.1. Research Approach |
|
2.1.1. Top-Down Method |
|
2.1.2. Bottom-Up Method |
|
2.1.3. Factor Impact Analysis |
|
2.2. Insights & Data Collection Process |
|
2.2.1. Secondary Research |
|
2.2.2. Primary Research |
|
2.3. Data Mining Process |
|
2.3.1. Data Analysis |
|
2.3.2. Data Validation and Revalidation |
|
2.3.3. Data Triangulation |
|
3. Executive Summary |
|
3.1. Major Markets & Segments |
|
3.2. Highest Growing Regions and Respective Countries |
|
3.3. Impact of Growth Drivers & Inhibitors |
|
3.4. Regulatory Overview by Country |
|
4. Chemical Hydrogen Generation Market, by Product Type (Market Size & Forecast: USD Million, 2022 – 2030) |
|
4.1. Electrolysis-Based Hydrogen Generation |
|
4.2. Steam Methane Reforming (SMR) |
|
4.3. Partial Oxidation |
|
4.4. Coal Gasification |
|
4.5. Others |
|
5. Chemical Hydrogen Generation Market, by End-User Industry (Market Size & Forecast: USD Million, 2022 – 2030) |
|
5.1. Oil & Gas |
|
5.2. Chemicals & Fertilizers |
|
5.3. Food & Beverage |
|
5.4. Metals & Mining |
|
5.5. Energy & Power |
|
5.6. Others |
|
6. Chemical Hydrogen Generation Market, by Technology (Market Size & Forecast: USD Million, 2022 – 2030) |
|
6.1. Proton Exchange Membrane (PEM) Electrolysis |
|
6.2. Alkaline Electrolysis |
|
6.3. Solid Oxide Electrolysis |
|
6.4. High-Temperature Gas Electrolysis |
|
6.5. Others |
|
7. Chemical Hydrogen Generation Market, by Application (Market Size & Forecast: USD Million, 2022 – 2030) |
|
7.1. Industrial Hydrogen Production |
|
7.2. Fuel Cells |
|
7.3. Oil Refining |
|
7.4. Power Generation |
|
7.5. Other Applications |
|
8. Regional Analysis (Market Size & Forecast: USD Million, 2022 – 2030) |
|
8.1. Regional Overview |
|
8.2. North America |
|
8.2.1. Regional Trends & Growth Drivers |
|
8.2.2. Barriers & Challenges |
|
8.2.3. Opportunities |
|
8.2.4. Factor Impact Analysis |
|
8.2.5. Technology Trends |
|
8.2.6. North America Chemical Hydrogen Generation Market, by Product Type |
|
8.2.7. North America Chemical Hydrogen Generation Market, by End-User Industry |
|
8.2.8. North America Chemical Hydrogen Generation Market, by Technology |
|
8.2.9. North America Chemical Hydrogen Generation Market, by |
|
8.2.10. By Country |
|
8.2.10.1. US |
|
8.2.10.1.1. US Chemical Hydrogen Generation Market, by Product Type |
|
8.2.10.1.2. US Chemical Hydrogen Generation Market, by End-User Industry |
|
8.2.10.1.3. US Chemical Hydrogen Generation Market, by Technology |
|
8.2.10.1.4. US Chemical Hydrogen Generation Market, by |
|
8.2.10.2. Canada |
|
8.2.10.3. Mexico |
|
*Similar segmentation will be provided for each region and country |
|
8.3. Europe |
|
8.4. Asia-Pacific |
|
8.5. Latin America |
|
8.6. Middle East & Africa |
|
9. Competitive Landscape |
|
9.1. Overview of the Key Players |
|
9.2. Competitive Ecosystem |
|
9.2.1. Level of Fragmentation |
|
9.2.2. Market Consolidation |
|
9.2.3. Product Innovation |
|
9.3. Company Share Analysis |
|
9.4. Company Benchmarking Matrix |
|
9.4.1. Strategic Overview |
|
9.4.2. Product Innovations |
|
9.5. Start-up Ecosystem |
|
9.6. Strategic Competitive Insights/ Customer Imperatives |
|
9.7. ESG Matrix/ Sustainability Matrix |
|
9.8. Manufacturing Network |
|
9.8.1. Locations |
|
9.8.2. Supply Chain and Logistics |
|
9.8.3. Product Flexibility/Customization |
|
9.8.4. Digital Transformation and Connectivity |
|
9.8.5. Environmental and Regulatory Compliance |
|
9.9. Technology Readiness Level Matrix |
|
9.10. Technology Maturity Curve |
|
9.11. Buying Criteria |
|
10. Company Profiles |
|
10.1. Air Liquide |
|
10.1.1. Company Overview |
|
10.1.2. Company Financials |
|
10.1.3. Product/Service Portfolio |
|
10.1.4. Recent Developments |
|
10.1.5. IMR Analysis |
|
*Similar information will be provided for other companies |
|
10.2. Linde Group |
|
10.3. Iwatani Corporation |
|
10.4. Hydrogenics (Cummins Inc.) |
|
10.5. ITM Power |
|
10.6. Ballard Power Systems |
|
10.7. Plug Power Inc. |
|
10.8. Siemens Energy |
|
10.9. Praxair Inc. (Linde Group) |
|
10.10. Air Products and Chemicals, Inc. |
|
10.11. Toshiba Energy Systems & Solutions Corporation |
|
10.12. Nel ASA |
|
10.13. Hyundai Motor Group |
|
10.14. Shell Global Solutions |
|
10.15. McPhy Energy |
|
11. Appendix |
A comprehensive market research approach was employed to gather and analyze data on the Chemical Hydrogen Generation Market. In the process, the analysis was also done to analyze the parent market and relevant adjacencies to measure the impact of them on the Chemical Hydrogen Generation Market. The research methodology encompassed both secondary and primary research techniques, ensuring the accuracy and credibility of the findings.

Secondary Research
Secondary research involved a thorough review of pertinent industry reports, journals, articles, and publications. Additionally, annual reports, press releases, and investor presentations of industry players were scrutinized to gain insights into their market positioning and strategies.
Primary Research
Primary research involved conducting in-depth interviews with industry experts, stakeholders, and market participants across the Chemical Hydrogen Generation ecosystem. The primary research objectives included:
- Validating findings and assumptions derived from secondary research
- Gathering qualitative and quantitative data on market trends, drivers, and challenges
- Understanding the demand-side dynamics, encompassing end-users, component manufacturers, facility providers, and service providers
- Assessing the supply-side landscape, including technological advancements and recent developments
Market Size Assessment
A combination of top-down and bottom-up approaches was utilized to analyze the overall size of the Chemical Hydrogen Generation Market. These methods were also employed to assess the size of various subsegments within the market. The market size assessment methodology encompassed the following steps:
- Identification of key industry players and relevant revenues through extensive secondary research
- Determination of the industry's supply chain and market size, in terms of value, through primary and secondary research processes
- Calculation of percentage shares, splits, and breakdowns using secondary sources and verification through primary sources

Data Triangulation
To ensure the accuracy and reliability of the market size, data triangulation was implemented. This involved cross-referencing data from various sources, including demand and supply side factors, market trends, and expert opinions. Additionally, top-down and bottom-up approaches were employed to validate the market size assessment.
NA