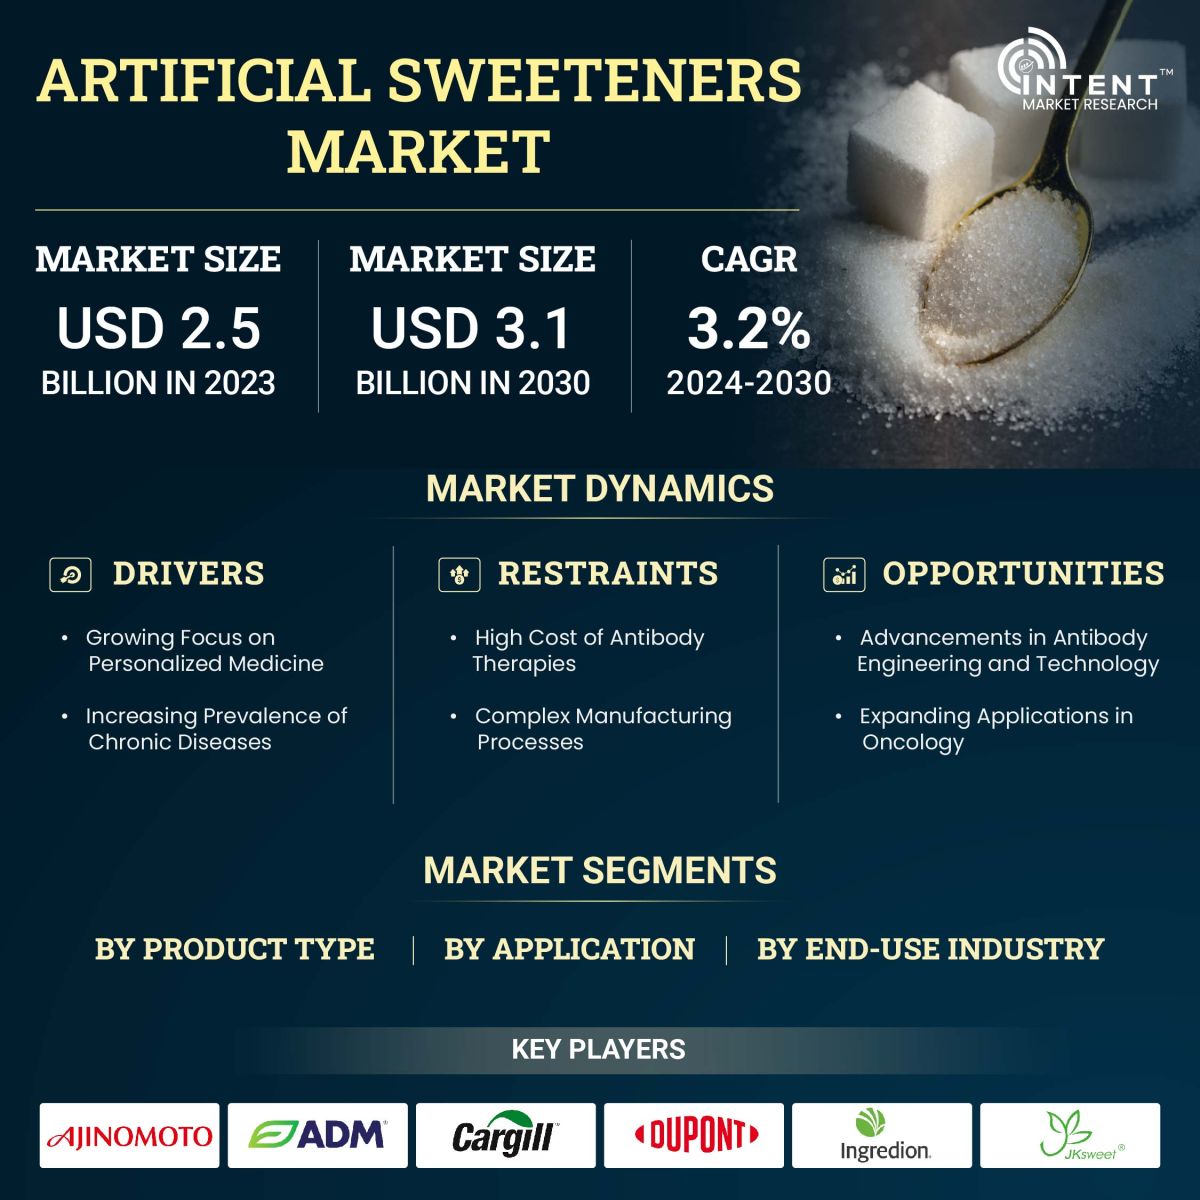
As per Intent Market Research, the Artificial Sweeteners Market was valued at USD 2.5 billion in 2023 and will surpass USD 3.1 billion by 2030; growing at a CAGR of 3.2% during 2024 - 2030.
The artificial sweeteners market has seen rapid growth in recent years, driven by increasing consumer demand for low-calorie and low-sugar food and beverage options. With heightened awareness around health and wellness, artificial sweeteners have gained popularity as sugar substitutes, appealing to consumers seeking to reduce their sugar intake without sacrificing taste. This market encompasses a variety of product types and serves diverse applications, ranging from beverages to pharmaceuticals.
Acesulfame K Segment is Largest Owing to Broad Application and Stability
Acesulfame K leads the artificial sweeteners market as the largest product segment, largely due to its extensive use in food and beverage formulations. Known for its stability under heat and acidic conditions, Acesulfame K is highly compatible with various products, including carbonated beverages, baked goods, and chewing gum. This sweetener is often blended with other low-calorie sweeteners to enhance flavor profiles and mask any residual aftertaste, making it a preferred choice for manufacturers.
Additionally, its approval by global regulatory bodies such as the FDA and EFSA has bolstered its adoption across multiple industries, contributing to its market leadership. The product’s low-cost profile and shelf stability make it a favorable choice for manufacturers aiming to meet consumer preferences for low-calorie alternatives without raising production costs.
.JPG)
Beverages Application Segment is Fastest Growing Due to Rising Low-Calorie Drink Demand
The beverages application segment is projected to be the fastest-growing in the artificial sweeteners market, driven by consumer demand for low- and zero-calorie beverages. As more consumers seek to reduce their sugar intake, beverage manufacturers have increasingly turned to artificial sweeteners to maintain sweetness without added calories. This trend is especially strong in carbonated soft drinks, flavored waters, and sports drinks, where artificial sweeteners like aspartame and sucralose are commonly used.
Furthermore, major beverage companies have made significant investments in research and development to create reformulated products that use these sweeteners without compromising on taste. This focus on innovation, coupled with consumer demand for healthier drink options, has contributed to rapid growth in this segment.
Food & Beverage End-Use Industry is Largest Due to Diverse Application Range
The food & beverage industry represents the largest end-use industry for artificial sweeteners, encompassing various applications such as baked goods, confectioneries, and processed foods. Artificial sweeteners are essential in these products as they allow manufacturers to offer low-calorie and sugar-free options, catering to health-conscious consumers. The versatility of sweeteners such as sucralose and aspartame has enabled their integration into a wide array of food items, supporting the growing demand for alternative sweetening solutions.
This industry's reliance on artificial sweeteners is further strengthened by rising health trends and regulatory pressures to reduce sugar content in food products. Manufacturers have continued to innovate by creating new product lines and reformulating existing products to use artificial sweeteners, solidifying the dominance of this industry in the market.
North America is the Largest Market Due to High Demand for Sugar Alternatives
North America holds the largest share in the artificial sweeteners market, driven by high demand for sugar substitutes and a strong consumer focus on health and wellness. The U.S., in particular, has seen widespread adoption of artificial sweeteners in food and beverages, fueled by consumer preferences for low-calorie products and a rise in diet-related health issues, including obesity and diabetes.
Additionally, government initiatives and guidelines encouraging reduced sugar consumption have played a significant role in propelling the use of artificial sweeteners. North American companies are also leading the way in research and innovation, developing new and improved artificial sweetener formulations to meet diverse consumer needs.
.JPG)
Competitive Landscape and Key Players
The artificial sweeteners market is highly competitive, with several key players dominating the landscape, including Ajinomoto Co., Inc., Archer Daniels Midland, Cargill, DuPont, Ingredion, and Tate & Lyle. These companies have substantial investments in research and development, aiming to create innovative, high-intensity sweeteners with minimal aftertaste and enhanced stability. Mergers, acquisitions, and strategic collaborations, such as the partnership between DuPont and Cargill, have further fueled competition, allowing companies to leverage each other’s strengths in production and innovation.
Moreover, these companies are adapting to the clean-label trend by focusing on natural-derived artificial sweeteners and reformulating their products to align with evolving consumer preferences. With significant advancements in product formulation and manufacturing processes, the artificial sweeteners market is poised for continued growth, led by industry leaders committed to meeting consumer demand for healthier sugar alternatives.
Recent Developments:
- Ajinomoto Co., Inc. recently launched AJISWEET RA, a new stevia-based sweetener, targeting flavor challenges faced by U.S. food and beverage manufacturers focusing on healthier products.
- Cargill introduced TruSweet 01795, a sweetener that allows food and beverage manufacturers to reduce sugar content by up to 30%, catering to the increased demand for health-conscious options.
- Nestlé committed to new R&D investments to develop low-sugar alternatives, aiming to support growing consumer demand within the confectionery and beverage markets for healthier products.
- Tate & Lyle launched a zero-calorie sweetener in North America, expanding its offerings to food manufacturers focused on providing healthier, sugar-free options to consumers.
- DuPont Nutrition & Health collaborated with Cargill to create a high-intensity sweetener, addressing clean-label trends and meeting the growing preference for natural ingredients in food and beverage products.
List of Leading Companies:
- Ajinomoto Co., Inc.
- Archer Daniels Midland
- Cargill
- DuPont
- Ingredion
- JK Sucralose Inc.
- Nestlé
- Roquette Frères
- Tate & Lyle
- Wilmar International
Report Scope:
|
Report Features |
Description |
|
Market Size (2023) |
USD 2.5 billion |
|
Forecasted Value (2030) |
USD 3.1 billion |
|
CAGR (2024 – 2030) |
3.2% |
|
Base Year for Estimation |
2023 |
|
Historic Year |
2022 |
|
Forecast Period |
2024 – 2030 |
|
Report Coverage |
Market Forecast, Market Dynamics, Competitive Landscape, Recent Developments |
|
Segments Covered |
Artificial Sweeteners Market by Product Type (Acesulfame K, Aspartame, Saccharin, Sucralose, Neotame), by Application (Beverages, Bakery Goods, Sweet Spreads, Confectionery & Chewing Gums, Dairy Products), and by End-Use Industry (Food & Beverage, Pharmaceuticals, Personal Care) |
|
Regional Analysis |
North America (US, Canada, Mexico), Europe (Germany, France, UK, Italy, Spain, and Rest of Europe), Asia-Pacific (China, Japan, South Korea, Australia, India, and Rest of Asia-Pacific), Latin America (Brazil, Argentina, and Rest of Latin America), Middle East & Africa (Saudi Arabia, UAE, Rest of Middle East & Africa) |
|
Major Companies |
Ajinomoto Co., Inc., Archer Daniels Midland, Cargill, DuPont, Ingredion, JK Sucralose Inc., Nestlé, Roquette Frères, Tate & Lyle Wilmar International |
|
Customization Scope |
Customization for segments, region/country-level will be provided. Moreover, additional customization can be done based on the requirements |
|
1. Introduction |
|
1.1. Market Definition |
|
1.2. Scope of the Study |
|
1.3. Research Assumptions |
|
1.4. Study Limitations |
|
2. Research Methodology |
|
2.1. Research Approach |
|
2.1.1. Top-Down Method |
|
2.1.2. Bottom-Up Method |
|
2.1.3. Factor Impact Analysis |
|
2.2. Insights & Data Collection Process |
|
2.2.1. Secondary Research |
|
2.2.2. Primary Research |
|
2.3. Data Mining Process |
|
2.3.1. Data Analysis |
|
2.3.2. Data Validation and Revalidation |
|
2.3.3. Data Triangulation |
|
3. Executive Summary |
|
3.1. Major Markets & Segments |
|
3.2. Highest Growing Regions and Respective Countries |
|
3.3. Impact of Growth Drivers & Inhibitors |
|
3.4. Regulatory Overview by Country |
|
4. Artificial Sweeteners Market, by Product Type (Market Size & Forecast: USD Million, 2022 – 2030) |
|
4.1. Acesulfame K |
|
4.2. Aspartame |
|
4.3. Saccharin |
|
4.4. Sucralose |
|
4.5. Neotame |
|
5. Artificial Sweeteners Market, by Application (Market Size & Forecast: USD Million, 2022 – 2030) |
|
5.1. Beverages |
|
5.2. Bakery Goods |
|
5.3. Sweet Spreads |
|
5.4. Confectionery & Chewing Gums |
|
5.5. Dairy Products |
|
5.6. Others |
|
6. Artificial Sweeteners Market, by End-Use Industry (Market Size & Forecast: USD Million, 2022 – 2030) |
|
6.1. Food & Beverage |
|
6.2. Pharmaceuticals |
|
6.3. Personal Care |
|
6.4. Others |
|
7. Regional Analysis (Market Size & Forecast: USD Million, 2022 – 2030) |
|
7.1. Regional Overview |
|
7.2. North America |
|
7.2.1. Regional Trends & Growth Drivers |
|
7.2.2. Barriers & Challenges |
|
7.2.3. Opportunities |
|
7.2.4. Factor Impact Analysis |
|
7.2.5. Technology Trends |
|
7.2.6. North America Artificial Sweeteners Market, by Product Type |
|
7.2.7. North America Artificial Sweeteners Market, by Application |
|
7.2.8. North America Artificial Sweeteners Market, by End-Use Industry |
|
7.2.9. By Country |
|
7.2.9.1. US |
|
7.2.9.1.1. US Artificial Sweeteners Market, by Product Type |
|
7.2.9.1.2. US Artificial Sweeteners Market, by Application |
|
7.2.9.1.3. US Artificial Sweeteners Market, by End-Use Industry |
|
7.2.9.2. Canada |
|
7.2.9.3. Mexico |
|
*Similar segmentation will be provided for each region and country |
|
7.3. Europe |
|
7.4. Asia-Pacific |
|
7.5. Latin America |
|
7.6. Middle East & Africa |
|
8. Competitive Landscape |
|
8.1. Overview of the Key Players |
|
8.2. Competitive Ecosystem |
|
8.2.1. Level of Fragmentation |
|
8.2.2. Market Consolidation |
|
8.2.3. Product Innovation |
|
8.3. Company Share Analysis |
|
8.4. Company Benchmarking Matrix |
|
8.4.1. Strategic Overview |
|
8.4.2. Product Innovations |
|
8.5. Start-up Ecosystem |
|
8.6. Strategic Competitive Insights/ Customer Imperatives |
|
8.7. ESG Matrix/ Sustainability Matrix |
|
8.8. Manufacturing Network |
|
8.8.1. Locations |
|
8.8.2. Supply Chain and Logistics |
|
8.8.3. Product Flexibility/Customization |
|
8.8.4. Digital Transformation and Connectivity |
|
8.8.5. Environmental and Regulatory Compliance |
|
8.9. Technology Readiness Level Matrix |
|
8.10. Technology Maturity Curve |
|
8.11. Buying Criteria |
|
9. Company Profiles |
|
9.1. Ajinomoto Co., Inc. |
|
9.1.1. Company Overview |
|
9.1.2. Company Financials |
|
9.1.3. Product/Service Portfolio |
|
9.1.4. Recent Developments |
|
9.1.5. IMR Analysis |
|
*Similar information will be provided for other companies |
|
9.2. Archer Daniels Midland |
|
9.3. Cargill |
|
9.4. DuPont |
|
9.5. Ingredion |
|
9.6. JK Sucralose Inc. |
|
9.7. Nestlé |
|
9.8. Roquette Frères |
|
9.9. Tate & Lyle |
|
9.10. Wilmar International |
|
10. Appendix |
A comprehensive market research approach was employed to gather and analyze data on the Artificial Sweeteners Market. In the process, the analysis was also done to analyze the parent market and relevant adjacencies to measure the impact of them on the Artificial Sweeteners Market. The research methodology encompassed both secondary and primary research techniques, ensuring the accuracy and credibility of the findings.
.jpg)
Secondary Research
Secondary research involved a thorough review of pertinent industry reports, journals, articles, and publications. Additionally, annual reports, press releases, and investor presentations of industry players were scrutinized to gain insights into their market positioning and strategies.
Primary Research
Primary research involved conducting in-depth interviews with industry experts, stakeholders, and market participants across the Artificial Sweeteners ecosystem. The primary research objectives included:
- Validating findings and assumptions derived from secondary research
- Gathering qualitative and quantitative data on market trends, drivers, and challenges
- Understanding the demand-side dynamics, encompassing end-users, component manufacturers, facility providers, and service providers
- Assessing the supply-side landscape, including technological advancements and recent developments
Market Size Assessment
A combination of top-down and bottom-up approaches was utilized to analyze the overall size of the Artificial Sweeteners Market. These methods were also employed to assess the size of various subsegments within the market. The market size assessment methodology encompassed the following steps:
- Identification of key industry players and relevant revenues through extensive secondary research
- Determination of the industry's supply chain and market size, in terms of value, through primary and secondary research processes
- Calculation of percentage shares, splits, and breakdowns using secondary sources and verification through primary sources
.jpg)
Data Triangulation
To ensure the accuracy and reliability of the market size, data triangulation was implemented. This involved cross-referencing data from various sources, including demand and supply side factors, market trends, and expert opinions. Additionally, top-down and bottom-up approaches were employed to validate the market size assessment.