As per Intent Market Research, the AR and VR In Manufacturing Market was valued at USD 1.5 billion in 2024-e and will surpass USD 4.0 billion by 2030; growing at a CAGR of 17.8% during 2025 - 2030.
The AR and VR in manufacturing market is experiencing substantial growth as these technologies offer transformative solutions to improve productivity, reduce costs, and enhance operational efficiency in manufacturing processes. Augmented reality (AR) and virtual reality (VR) are being increasingly integrated into various stages of manufacturing, from design and prototyping to training, maintenance, and quality control. These technologies enable immersive experiences that allow workers to visualize complex systems, simulate scenarios, and interact with digital models in real-time, offering significant advantages in terms of precision and decision-making.
The adoption of AR and VR is accelerating, particularly in industries such as automotive, aerospace, electronics, and industrial equipment manufacturing. These technologies help in visualizing manufacturing processes, improving collaboration across teams, and optimizing designs before production. As the cost of VR and AR hardware decreases and software capabilities advance, more manufacturers are recognizing the potential of these technologies to streamline operations, improve safety, and enhance the overall production process. This trend is expected to continue, with increased investments and widespread adoption across various manufacturing sectors.
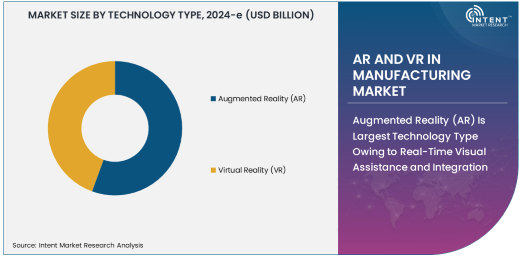
Augmented Reality (AR) Is Largest Technology Type Owing to Real-Time Visual Assistance and Integration
Augmented reality (AR) is the largest technology type in the AR and VR in manufacturing market, owing to its ability to overlay digital information onto the physical world in real-time. AR applications in manufacturing include maintenance, repair, assembly, and quality control, where workers can access step-by-step instructions, schematics, and diagnostic information without needing to consult separate manuals or documents. The integration of AR with wearable devices, such as smart glasses, allows for hands-free assistance, improving efficiency and reducing the likelihood of errors.
The ability of AR to enhance real-time decision-making and provide immediate feedback is a key driver of its widespread adoption in manufacturing. By offering real-time visualization of complex systems, AR helps workers perform tasks with greater accuracy and speed. Furthermore, AR can be integrated with Internet of Things (IoT) devices to monitor equipment performance and provide predictive maintenance alerts, reducing downtime and improving overall operational efficiency. This combination of practicality and innovation makes AR the dominant technology in the market, with applications spanning various manufacturing sectors.
Virtual Reality (VR) Is Fastest Growing Technology Type Owing to Immersive Training and Simulation Capabilities
Virtual reality (VR) is the fastest-growing technology type in the AR and VR in manufacturing market, primarily due to its immersive training and simulation capabilities. VR enables manufacturers to create realistic, computer-generated environments where employees can engage in hands-on training without the need for physical resources or the risk of costly mistakes. This is particularly valuable in industries such as aerospace and automotive, where high-stakes simulations are necessary to train workers on complex assembly lines or to test equipment in virtual environments before it is used in real production.
The adoption of VR for training and simulation is accelerating, as it offers a safe and cost-effective alternative to traditional methods. VR can replicate scenarios that are difficult or dangerous to reproduce in real life, allowing employees to practice skills and troubleshoot issues in a controlled setting. As VR technology continues to advance, with improvements in graphics, realism, and interactivity, its use in manufacturing training is expected to expand rapidly, positioning VR as a key tool in workforce development and operational efficiency.
Automotive Industry Is Largest End-User Owing to Complex Manufacturing Processes and Innovation Demands
The automotive industry is the largest end-user of AR and VR technologies in manufacturing, owing to its complex manufacturing processes and the industry's constant drive for innovation. Automotive manufacturers use AR and VR for a variety of applications, including design, prototyping, assembly, quality control, and training. For example, VR is used to simulate car assembly processes and test new vehicle designs, while AR is applied to assist technicians during vehicle repairs by overlaying relevant information on the physical vehicle.
The automotive industry benefits greatly from the integration of AR and VR, as these technologies help streamline production processes, reduce errors, and improve the overall design and manufacturing efficiency. Additionally, with the rise of electric vehicles (EVs) and autonomous driving technologies, automotive manufacturers are investing heavily in AR and VR to accelerate the development of new models and technologies. As the automotive industry continues to innovate and adapt to new demands, the use of AR and VR is expected to increase, solidifying its position as the largest end-user segment.
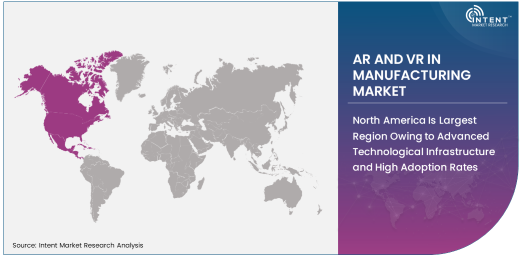
North America Is Largest Region Owing to Advanced Technological Infrastructure and High Adoption Rates
North America is the largest region in the AR and VR in manufacturing market, driven by the region's advanced technological infrastructure and high adoption rates of digital solutions. The United States and Canada are at the forefront of implementing AR and VR technologies across various manufacturing industries, particularly in automotive, aerospace, and industrial equipment manufacturing. North America's manufacturing sectors have been quick to adopt these technologies to enhance productivity, improve safety standards, and optimize supply chains.
The region's dominance is also attributed to the strong presence of key technology providers, such as Microsoft, Google, and PTC, which offer AR and VR solutions tailored to the specific needs of manufacturers. Additionally, North American companies are investing heavily in the development and deployment of AR and VR systems to stay competitive in an increasingly globalized market. As companies in North America continue to lead in technological innovation and implementation, the region is expected to maintain its position as the largest market for AR and VR in manufacturing.
Leading Companies and Competitive Landscape
The AR and VR in manufacturing market is highly competitive, with numerous global and regional players offering a range of solutions to meet the diverse needs of manufacturers. Key players in the market include Microsoft, PTC, Siemens, Dassault Systèmes, and Vuzix Corporation, which provide both hardware and software solutions designed to integrate AR and VR into manufacturing workflows. These companies are focused on enhancing the capabilities of AR and VR technologies, particularly in training, maintenance, and design applications.
The competitive landscape is also shaped by the growing number of startups and niche players that specialize in industry-specific AR and VR solutions. Companies are increasingly collaborating with hardware manufacturers, such as Oculus and Magic Leap, to develop more advanced VR headsets and AR glasses that are tailored for industrial use. As the market continues to evolve, companies that can offer scalable, customizable, and cost-effective AR and VR solutions will have a significant competitive advantage. With continued investments in R&D and the expansion of product offerings, the competitive environment in the AR and VR in manufacturing market is expected to remain dynamic and innovative.
Recent Developments:
- In December 2024, PTC Inc. launched an upgraded AR platform for manufacturing, enabling real-time assembly line monitoring and maintenance support.
- In November 2024, Siemens AG expanded its VR-based training solutions for industrial workers, introducing new modules for safety training and equipment operation.
- In October 2024, General Electric (GE) introduced a VR training system for aviation technicians, enhancing their ability to perform high-precision repairs.
- In September 2024, HTC Corporation unveiled a new AR headset designed for assembly line workers to receive on-site digital guidance in real time.
- In August 2024, Oculus VR (Facebook Technologies, LLC) partnered with several manufacturing giants to implement VR-based training simulators in factories worldwide.
List of Leading Companies:
- PTC Inc.
- Siemens AG
- Dassault Systèmes
- General Electric (GE)
- HTC Corporation
- Vuzix Corporation
- Microsoft Corporation
- Bosch Rexroth AG
- Linde Group
- Honeywell International Inc.
- Rockwell Automation
- EON Reality
- Oculus VR (Facebook Technologies, LLC)
- Zebra Medical Vision
- Varjo Technologies
Report Scope:
|
Report Features |
Description |
|
Market Size (2024-e) |
USD 1.5 billion |
|
Forecasted Value (2030) |
USD 4.0 billion |
|
CAGR (2025 – 2030) |
17.8% |
|
Base Year for Estimation |
2024-e |
|
Historic Year |
2023 |
|
Forecast Period |
2025 – 2030 |
|
Report Coverage |
Market Forecast, Market Dynamics, Competitive Landscape, Recent Developments |
|
Segments Covered |
AR and VR In Manufacturing Market By Technology Type (Augmented Reality (AR), Virtual Reality (VR)), By Application (Training and Simulation, Maintenance and Repair, Assembly and Production, Quality Control, Design and Prototyping), By End-User (Automotive Industry, Aerospace Industry, Electronics Industry, Industrial Equipment Manufacturing, Consumer Goods Manufacturing) |
|
Regional Analysis |
North America (US, Canada, Mexico), Europe (Germany, France, UK, Italy, Spain, and Rest of Europe), Asia-Pacific (China, Japan, South Korea, Australia, India, and Rest of Asia-Pacific), Latin America (Brazil, Argentina, and Rest of Latin America), Middle East & Africa (Saudi Arabia, UAE, Rest of Middle East & Africa) |
|
Major Companies |
PTC Inc., Siemens AG, Dassault Systèmes, General Electric (GE), HTC Corporation, Vuzix Corporation, Microsoft Corporation, Bosch Rexroth AG, Linde Group, Honeywell International Inc., Rockwell Automation, EON Reality, Oculus VR (Facebook Technologies, LLC), Zebra Medical Vision, Varjo Technologies |
|
Customization Scope |
Customization for segments, region/country-level will be provided. Moreover, additional customization can be done based on the requirements |
|
1. Introduction |
|
1.1. Market Definition |
|
1.2. Scope of the Study |
|
1.3. Research Assumptions |
|
1.4. Study Limitations |
|
2. Research Methodology |
|
2.1. Research Approach |
|
2.1.1. Top-Down Method |
|
2.1.2. Bottom-Up Method |
|
2.1.3. Factor Impact Analysis |
|
2.2. Insights & Data Collection Process |
|
2.2.1. Secondary Research |
|
2.2.2. Primary Research |
|
2.3. Data Mining Process |
|
2.3.1. Data Analysis |
|
2.3.2. Data Validation and Revalidation |
|
2.3.3. Data Triangulation |
|
3. Executive Summary |
|
3.1. Major Markets & Segments |
|
3.2. Highest Growing Regions and Respective Countries |
|
3.3. Impact of Growth Drivers & Inhibitors |
|
3.4. Regulatory Overview by Country |
|
4. AR and VR In Manufacturing Market, by Technology Type (Market Size & Forecast: USD Million, 2023 – 2030) |
|
4.1. Augmented Reality (AR) |
|
4.2. Virtual Reality (VR) |
|
5. AR and VR In Manufacturing Market, by Application (Market Size & Forecast: USD Million, 2023 – 2030) |
|
5.1. Training and Simulation |
|
5.2. Maintenance and Repair |
|
5.3. Assembly and Production |
|
5.4. Quality Control |
|
5.5. Design and Prototyping |
|
6. AR and VR In Manufacturing Market, by End-User (Market Size & Forecast: USD Million, 2023 – 2030) |
|
6.1. Automotive Industry |
|
6.2. Aerospace Industry |
|
6.3. Electronics Industry |
|
6.4. Industrial Equipment Manufacturing |
|
6.5. Consumer Goods Manufacturing |
|
7. Regional Analysis (Market Size & Forecast: USD Million, 2023 – 2030) |
|
7.1. Regional Overview |
|
7.2. North America |
|
7.2.1. Regional Trends & Growth Drivers |
|
7.2.2. Barriers & Challenges |
|
7.2.3. Opportunities |
|
7.2.4. Factor Impact Analysis |
|
7.2.5. Technology Trends |
|
7.2.6. North America AR and VR In Manufacturing Market, by Technology Type |
|
7.2.7. North America AR and VR In Manufacturing Market, by Application |
|
7.2.8. North America AR and VR In Manufacturing Market, by End-User |
|
7.2.9. By Country |
|
7.2.9.1. US |
|
7.2.9.1.1. US AR and VR In Manufacturing Market, by Technology Type |
|
7.2.9.1.2. US AR and VR In Manufacturing Market, by Application |
|
7.2.9.1.3. US AR and VR In Manufacturing Market, by End-User |
|
7.2.9.2. Canada |
|
7.2.9.3. Mexico |
|
*Similar segmentation will be provided for each region and country |
|
7.3. Europe |
|
7.4. Asia-Pacific |
|
7.5. Latin America |
|
7.6. Middle East & Africa |
|
8. Competitive Landscape |
|
8.1. Overview of the Key Players |
|
8.2. Competitive Ecosystem |
|
8.2.1. Level of Fragmentation |
|
8.2.2. Market Consolidation |
|
8.2.3. Product Innovation |
|
8.3. Company Share Analysis |
|
8.4. Company Benchmarking Matrix |
|
8.4.1. Strategic Overview |
|
8.4.2. Product Innovations |
|
8.5. Start-up Ecosystem |
|
8.6. Strategic Competitive Insights/ Customer Imperatives |
|
8.7. ESG Matrix/ Sustainability Matrix |
|
8.8. Manufacturing Network |
|
8.8.1. Locations |
|
8.8.2. Supply Chain and Logistics |
|
8.8.3. Product Flexibility/Customization |
|
8.8.4. Digital Transformation and Connectivity |
|
8.8.5. Environmental and Regulatory Compliance |
|
8.9. Technology Readiness Level Matrix |
|
8.10. Technology Maturity Curve |
|
8.11. Buying Criteria |
|
9. Company Profiles |
|
9.1. PTC Inc. |
|
9.1.1. Company Overview |
|
9.1.2. Company Financials |
|
9.1.3. Product/Service Portfolio |
|
9.1.4. Recent Developments |
|
9.1.5. IMR Analysis |
|
*Similar information will be provided for other companies |
|
9.2. Siemens AG |
|
9.3. Dassault Systèmes |
|
9.4. General Electric (GE) |
|
9.5. HTC Corporation |
|
9.6. Vuzix Corporation |
|
9.7. Microsoft Corporation |
|
9.8. Bosch Rexroth AG |
|
9.9. Linde Group |
|
9.10. Honeywell International Inc. |
|
9.11. Rockwell Automation |
|
9.12. EON Reality |
|
9.13. Oculus VR (Facebook Technologies, LLC) |
|
9.14. Zebra Medical Vision |
|
9.15. Varjo Technologies |
|
10. Appendix |
A comprehensive market research approach was employed to gather and analyze data on the AR and VR In Manufacturing Market. In the process, the analysis was also done to analyze the parent market and relevant adjacencies to measure the impact of them on the AR and VR In Manufacturing Market. The research methodology encompassed both secondary and primary research techniques, ensuring the accuracy and credibility of the findings.
.jpg)
Secondary Research
Secondary research involved a thorough review of pertinent industry reports, journals, articles, and publications. Additionally, annual reports, press releases, and investor presentations of industry players were scrutinized to gain insights into their market positioning and strategies.
Primary Research
Primary research involved conducting in-depth interviews with industry experts, stakeholders, and market participants across the E-Waste Management ecosystem. The primary research objectives included:
- Validating findings and assumptions derived from secondary research
- Gathering qualitative and quantitative data on market trends, drivers, and challenges
- Understanding the demand-side dynamics, encompassing end-users, component manufacturers, facility providers, and service providers
- Assessing the supply-side landscape, including technological advancements and recent developments
Market Size Assessment
A combination of top-down and bottom-up approaches was utilized to analyze the overall size of the AR and VR In Manufacturing Market. These methods were also employed to assess the size of various subsegments within the market. The market size assessment methodology encompassed the following steps:
- Identification of key industry players and relevant revenues through extensive secondary research
- Determination of the industry's supply chain and market size, in terms of value, through primary and secondary research processes
- Calculation of percentage shares, splits, and breakdowns using secondary sources and verification through primary sources
.jpg)
Data Triangulation
To ensure the accuracy and reliability of the market size, data triangulation was implemented. This involved cross-referencing data from various sources, including demand and supply side factors, market trends, and expert opinions. Additionally, top-down and bottom-up approaches were employed to validate the market size assessment.
NA