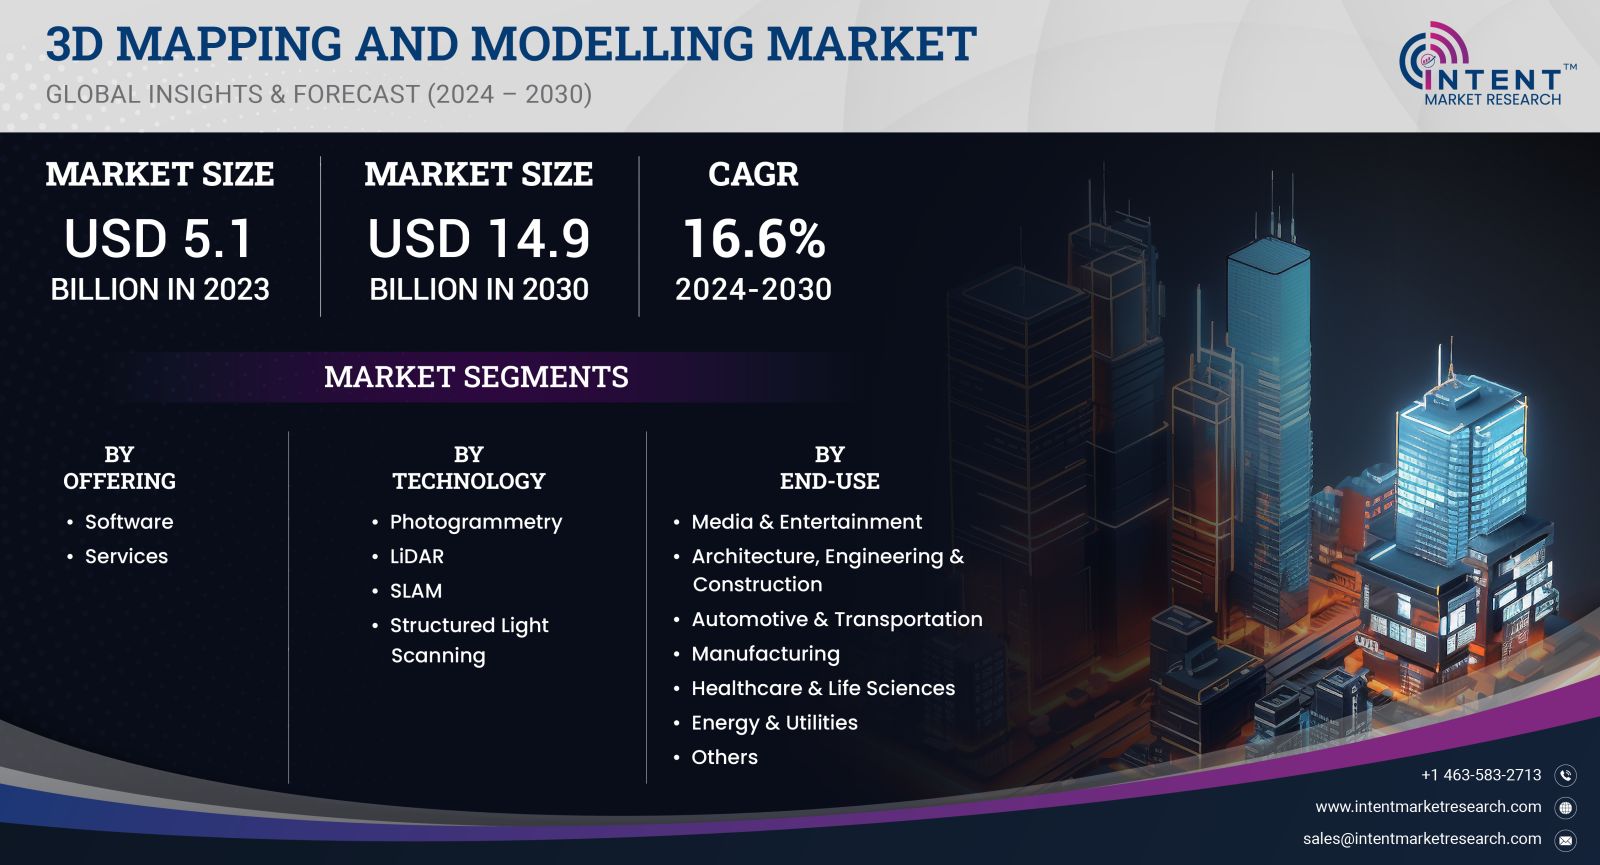
As per Intent Market Research, the 3D Mapping and Modelling Market was valued at USD 5.1 billion in 2023-e and will surpass USD 14.9 billion by 2030; growing at a CAGR of 16.6% during 2024 - 2030.
The 3D Mapping and Modeling market has emerged as a vital component in various sectors, including construction, urban planning, and entertainment, driven by advancements in technology and growing demand for visual data representation. As industries increasingly adopt 3D technologies for enhanced accuracy, efficiency, and visualization, the market is expected to witness significant growth. The integration of artificial intelligence (AI), the Internet of Things (IoT), and machine learning in 3D mapping solutions is further propelling market growth, as businesses seek innovative ways to leverage spatial data for decision-making.
Geographic Information System (GIS) Segment is Largest Owing to Increasing Demand for Spatial Data Analysis
The Geographic Information System (GIS) segment stands as the largest sub-segment within the 3D Mapping and Modeling market, primarily due to the surging demand for spatial data analysis across various industries. GIS technology enables organizations to visualize, analyze, and interpret data in relation to geographical locations, offering valuable insights for urban planning, environmental monitoring, and resource management. The increasing need for real-time data and analytics in sectors such as government, transportation, and agriculture is fueling the demand for GIS solutions, thereby solidifying its position as the largest segment.
Moreover, the adoption of GIS in smart city initiatives and infrastructure development projects is significantly contributing to market growth. Governments and municipalities are increasingly investing in GIS technology to optimize urban planning, manage resources more effectively, and improve public services. As the trend towards smart cities continues to gain momentum, the GIS segment is expected to sustain its leadership position in the 3D Mapping and Modeling market, reflecting a growing recognition of the value of spatial data in decision-making processes.
3D Modeling Segment is Fastest Growing Owing to Rising Popularity in Entertainment and Gaming
The 3D Modeling segment is recognized as the fastest-growing sub-segment within the 3D Mapping and Modeling market, propelled by the surging demand for realistic graphics and immersive experiences in the entertainment and gaming industries. With the advancement of technology, the capabilities of 3D modeling software have expanded, allowing for more intricate designs and animations. The gaming industry, in particular, is experiencing a transformative phase, with developers increasingly relying on sophisticated 3D modeling techniques to create engaging and visually stunning gaming environments.
In addition, the rise of virtual reality (VR) and augmented reality (AR) applications has further amplified the demand for 3D modeling solutions. Businesses are leveraging 3D modeling for product visualization, interactive simulations, and immersive storytelling, enabling them to connect with audiences on a deeper level. As the gaming and entertainment sectors continue to innovate and explore new creative avenues, the 3D Modeling segment is poised for exponential growth, reinforcing its position as the fastest-growing segment in the 3D Mapping and Modeling market.
Aerial Mapping Segment is Largest Owing to Advancements in Drone Technology
The Aerial Mapping segment holds the largest market share in the 3D Mapping and Modeling landscape, driven by significant advancements in drone technology. Drones equipped with high-resolution cameras and LiDAR sensors have revolutionized the way aerial data is collected and processed. This technology allows for the rapid generation of detailed 3D maps and models over vast areas, making it an essential tool in sectors such as construction, agriculture, and environmental monitoring. The ability to capture real-time data from hard-to-reach areas with minimal manpower is propelling the adoption of aerial mapping solutions across various industries.
Moreover, the integration of aerial mapping with GIS technologies enhances the accuracy and utility of spatial data, facilitating better decision-making in urban planning and disaster management. As more industries recognize the benefits of aerial mapping, including cost savings and improved efficiency, the segment is expected to maintain its status as the largest in the 3D Mapping and Modeling market. The ongoing development of drone regulations and the emergence of autonomous drone technologies are likely to further boost the growth of the aerial mapping segment.
3D Laser Scanning Segment is Fastest Growing Owing to Enhanced Accuracy and Detail
The 3D Laser Scanning segment is the fastest-growing sub-segment in the 3D Mapping and Modeling market, thanks to its ability to capture precise and detailed data. 3D laser scanning technology utilizes laser beams to create high-resolution 3D models of physical objects and environments, offering unmatched accuracy in data collection. This capability is particularly valuable in industries such as construction, heritage preservation, and manufacturing, where precise measurements are critical. As organizations increasingly prioritize accuracy in their projects, the demand for 3D laser scanning solutions is expected to rise significantly.
Furthermore, the application of 3D laser scanning in Building Information Modeling (BIM) is driving its adoption in the construction sector. By integrating laser-scanned data into BIM workflows, architects and engineers can streamline project planning, reduce errors, and improve collaboration among stakeholders. As the construction industry embraces digital transformation, the 3D Laser Scanning segment is likely to witness robust growth, solidifying its position as the fastest-growing segment in the 3D Mapping and Modeling market.
Building Information Modeling (BIM) Segment is Largest Owing to Increased Adoption in Construction Projects
The Building Information Modeling (BIM) segment is the largest in the 3D Mapping and Modeling market, largely due to the rising adoption of digital tools in construction projects. BIM technology facilitates a collaborative approach to project design and management by allowing stakeholders to create and manage a digital representation of a building throughout its lifecycle. This capability improves project efficiency, reduces costs, and enhances communication among architects, engineers, and contractors. As the construction industry increasingly recognizes the value of BIM in optimizing project delivery, the segment has gained significant traction.
Moreover, the global push for sustainable construction practices has further amplified the adoption of BIM technology. By utilizing BIM, construction professionals can evaluate the environmental impact of their designs and identify opportunities for energy efficiency and resource conservation. As sustainable building practices become more prevalent, the BIM segment is expected to continue dominating the 3D Mapping and Modeling market, reflecting the industry's commitment to innovation and efficiency.
Fastest Growing Region in the 3D Mapping and Modeling Market: Asia-Pacific
The Asia-Pacific region is anticipated to be the fastest-growing market for 3D Mapping and Modeling, driven by rapid urbanization, technological advancements, and increased investments in infrastructure development. Countries such as China, India, and Japan are witnessing a surge in demand for 3D mapping solutions across various sectors, including construction, transportation, and environmental management. The region's increasing focus on smart city initiatives and digital transformation is propelling the adoption of 3D technologies, as governments and private enterprises seek innovative ways to enhance urban planning and resource management.
Furthermore, the rise of emerging technologies such as AI, IoT, and big data analytics is contributing to the growth of the 3D Mapping and Modeling market in the Asia-Pacific region. These technologies enable businesses to harness spatial data for improved decision-making and operational efficiency. As companies in the region continue to invest in advanced mapping and modeling solutions, the Asia-Pacific market is expected to experience robust growth, solidifying its position as a key player in the global 3D Mapping and Modeling landscape.
Competitive Landscape and Leading Companies
The competitive landscape of the 3D Mapping and Modeling market is characterized by a mix of established players and emerging startups, all vying for market share through innovation and strategic partnerships. Leading companies such as Esri, Autodesk, Bentley Systems, and Hexagon AB dominate the market, offering a comprehensive suite of solutions that cater to diverse industry needs. These companies are investing heavily in research and development to enhance their product offerings, focusing on incorporating advanced technologies such as AI and machine learning into their mapping and modeling solutions.
Moreover, the market is witnessing a trend towards collaboration and partnerships among companies to leverage complementary strengths and expand their service offerings. Strategic alliances with technology providers, data analytics firms, and industry-specific solution developers are becoming increasingly common, enabling companies to create integrated solutions that meet the evolving demands of customers. As the market continues to expand, the competitive landscape is expected to evolve, with companies striving to differentiate themselves through innovation, customer-centric approaches, and enhanced service delivery.
Report Objectives:
The report will help you answer some of the most critical questions in the 3D Mapping and Modeling Market. A few of them are as follows:
- What are the key drivers, restraints, opportunities, and challenges influencing the market growth?
- What are the prevailing technology trends in the 3d mapping and modeling market?
- What is the size of the 3d mapping and modeling market based on segments, sub-segments, and regions?
- What is the size of different market segments across key regions: North America, Europe, Asia Pacific, Latin America, Middle East & Africa?
- What are the market opportunities for stakeholders after analyzing key market trends?
- Who are the leading market players and what are their market share and core competencies?
- What is the degree of competition in the market and what are the key growth strategies adopted by leading players?
- What is the competitive landscape of the market, including market share analysis, revenue analysis, and a ranking of key players?
Report Scope:
|
Report Features |
Description |
|
Market Size (2023-e) |
USD 5.1 billion |
|
Forecasted Value (2030) |
USD 14.9 billion |
|
CAGR (2024-2030) |
16.6% |
|
Base Year for Estimation |
2023-e |
|
Historic Year |
2022 |
|
Forecast Period |
2024-2030 |
|
Report Coverage |
Market Forecast, Market Dynamics, Competitive Landscape, Recent Developments |
|
Segments Covered |
3D Mapping and Modelling Market by Offering (Software, Services), By Technology (LiDAR, Photogrammetry, Structured Light Scanning, SLAM), By End-use (Architecture, Engineering & Construction, Automotive & Transportation, Media & Entertainment, Energy & Utilities, Healthcare & Life Sciences) |
|
Regional Analysis |
North America (US, Canada), Europe (Germany, France, UK, Spain, Italy & Rest of Europe), Asia Pacific (China, Japan, South Korea, India, and Rest of Asia Pacific), Latin America (Brazil, Mexico, Argentina, & Rest of Latin America), Middle East & Africa (Saudi Arabia, South Africa, Turkey, United Arab Emirates, & Rest of MEA) |
|
Customization Scope |
Customization for segments, region/country-level will be provided. Moreover, additional customization can be done based on the requirements |
|
1.Introduction |
|
1.1.Market Definition |
|
1.2.Scope of the Study |
|
1.3.Research Assumptions |
|
1.4.Study Limitations |
|
2.Research Methodology |
|
2.1.Research Approach |
|
2.1.1.Top-Down Method |
|
2.1.2.Bottom-Up Method |
|
2.1.3.Factor Impact Analysis |
|
2.2.Insights & Data Collection Process |
|
2.2.1.Secondary Research |
|
2.2.2.Primary Research |
|
2.3.Data Mining Process |
|
2.3.1.Data Analysis |
|
2.3.2.Data Validation and Revalidation |
|
2.3.3.Data Triangulation |
|
3.Executive Summary |
|
3.1.Major Markets & Segments |
|
3.2.Highest Growing Regions and Respective Countries |
|
3.3.Impact of Growth Drivers & Inhibitors |
|
3.4.Regulatory Overview by Country |
|
4. 3D Mapping and Modelling Market, by Offering (Market Size & Forecast: USD Billion, 2024 – 2030) |
|
4.1.Software |
|
4.2.Services |
|
5.3D Mapping and Modelling Market, by Technology (Market Size & Forecast: USD Billion, 2024 – 2030) |
|
5.1.Photogrammetry |
|
5.2.LiDAR |
|
5.3.SLAM |
|
5.4.Structured Light Scanning |
|
6.3D Mapping and Modelling Market, by End-use (Market Size & Forecast: USD Billion, 2024 – 2030) |
|
6.1.Media & Entertainment |
|
6.2.Architecture, Engineering & Construction |
|
6.3.Automotive & Transportation |
|
6.4.Manufacturing |
|
6.5.Healthcare & Life Sciences |
|
6.6.Energy & Utilities |
|
6.6.Others |
|
7.Regional Analysis (Market Size & Forecast: USD Billion, 2024 – 2030) |
|
7.1.Regional Overview |
|
7.2.North America |
|
7.2.1.Regional Trends & Growth Drivers |
|
7.2.2.Barriers & Challenges |
|
7.2.3.Opportunities |
|
7.2.4.Factor Impact Analysis |
|
7.2.5.Technology Trends |
|
7.2.6.North America 3D Mapping and Modelling Market, by Offering |
|
7.2.7.North America 3D Mapping and Modelling Market, by Technology |
|
7.2.8.North America 3D Mapping and Modelling Market, by End-use |
|
*Similar segmentation will be provided at each regional level |
|
7.3.By Country |
|
7.3.1.US |
|
7.3.1.1.US 3D Mapping and Modelling Market, by Offering |
|
7.3.1.2.US 3D Mapping and Modelling Market, by Technology |
|
7.3.1.3.US 3D Mapping and Modelling Market, by End-use |
|
7.3.2.Canada |
|
*Similar segmentation will be provided at each country level |
|
7.4.Europe |
|
7.5.APAC |
|
7.6.Latin America |
|
7.7.Middle East & Africa |
|
8.Competitive Landscape |
|
8.1.Overview of the Key Players |
|
8.2.Competitive Ecosystem |
|
8.2.1.Platform Manufacturers |
|
8.2.2.Subsystem Manufacturers |
|
8.2.3.Service Providers |
|
8.2.4.Software Providers |
|
8.3.Company Share Analysis |
|
8.4.Company Benchmarking Matrix |
|
8.4.1.Strategic Overview |
|
8.4.2.Product Innovations |
|
8.5.Start-up Ecosystem |
|
8.6.Strategic Competitive Insights/ Customer Imperatives |
|
8.7.ESG Matrix/ Sustainability Matrix |
|
8.8.Manufacturing Network |
|
8.8.1.Locations |
|
8.8.2.Supply Chain and Logistics |
|
8.8.3.Product Flexibility/Customization |
|
8.8.4.Digital Transformation and Connectivity |
|
8.8.5.Environmental and Regulatory Compliance |
|
8.9.Technology Readiness Level Matrix |
|
8.10.Technology Maturity Curve |
|
8.11.Buying Criteria |
|
9.Company Profiles |
|
9.1.Golden Software |
|
9.1.1.Company Overview |
|
9.1.2.Company Financials |
|
9.1.3.Product/Service Portfolio |
|
9.1.4.Recent Developments |
|
9.1.5.IMR Analysis |
|
*Similar information will be provided for other companies |
|
9.2.Alphabet |
|
9.3.Autodesk |
|
9.4.Trimble |
|
9.5.Bentley Systems |
|
9.6.Dassault Systemes |
|
9.7.Adobe |
|
9.8.Hexagon |
|
9.9.Lumen Technologies |
|
9.10.Citrix Systems |
|
10.Appendix |
A comprehensive market research approach was employed to gather and analyze data on the 3d mapping and modeling market. In the process, the analysis was also done to estimate the parent market and relevant adjacencies to major the impact of them on the 3d mapping and modeling Market. The research methodology encompassed both secondary and primary research techniques, ensuring the accuracy and credibility of the findings.
.jpg)
Secondary Research
Secondary research involved a thorough review of pertinent industry reports, journals, articles, and publications. Additionally, annual reports, press releases, and investor presentations of industry players were scrutinized to gain insights into their market positioning and strategies.
Primary Research
Primary research involved conducting in-depth interviews with industry experts, stakeholders, and market participants across the 3d mapping and modeling ecosystem. The primary research objectives included:
- Validating findings and assumptions derived from secondary research
- Gathering qualitative and quantitative data on market trends, drivers, and challenges
- Understanding the demand-side dynamics, encompassing end-users, component manufacturers, facility providers, and service providers
- Assessing the supply-side landscape, including technological advancements and recent developments
Market Size Estimation
A combination of top-down and bottom-up approaches was utilized to estimate the overall size of the 3d mapping and modeling market. These methods were also employed to estimate the size of various subsegments within the market. The market size estimation methodology encompassed the following steps:
- Identification of key industry players and relevant revenues through extensive secondary research
- Determination of the industry's supply chain and market size, in terms of value, through primary and secondary research processes
- Calculation of percentage shares, splits, and breakdowns using secondary sources and verification through primary sources
.jpg)
Data Triangulation
To ensure the accuracy and reliability of the market size estimates, data triangulation was implemented. This involved cross-referencing data from various sources, including demand and supply side factors, market trends, and expert opinions. Additionally, top-down and bottom-up approaches were employed to validate the market size estimates.
NA